25 Years of Traffic Accidents
Data Visualization
25 Years of Traffic Accidents
Data Visualization
During my studies of data visualization at the Bern University of Applied Sciences we were commissioned to carry out a project during our studies.
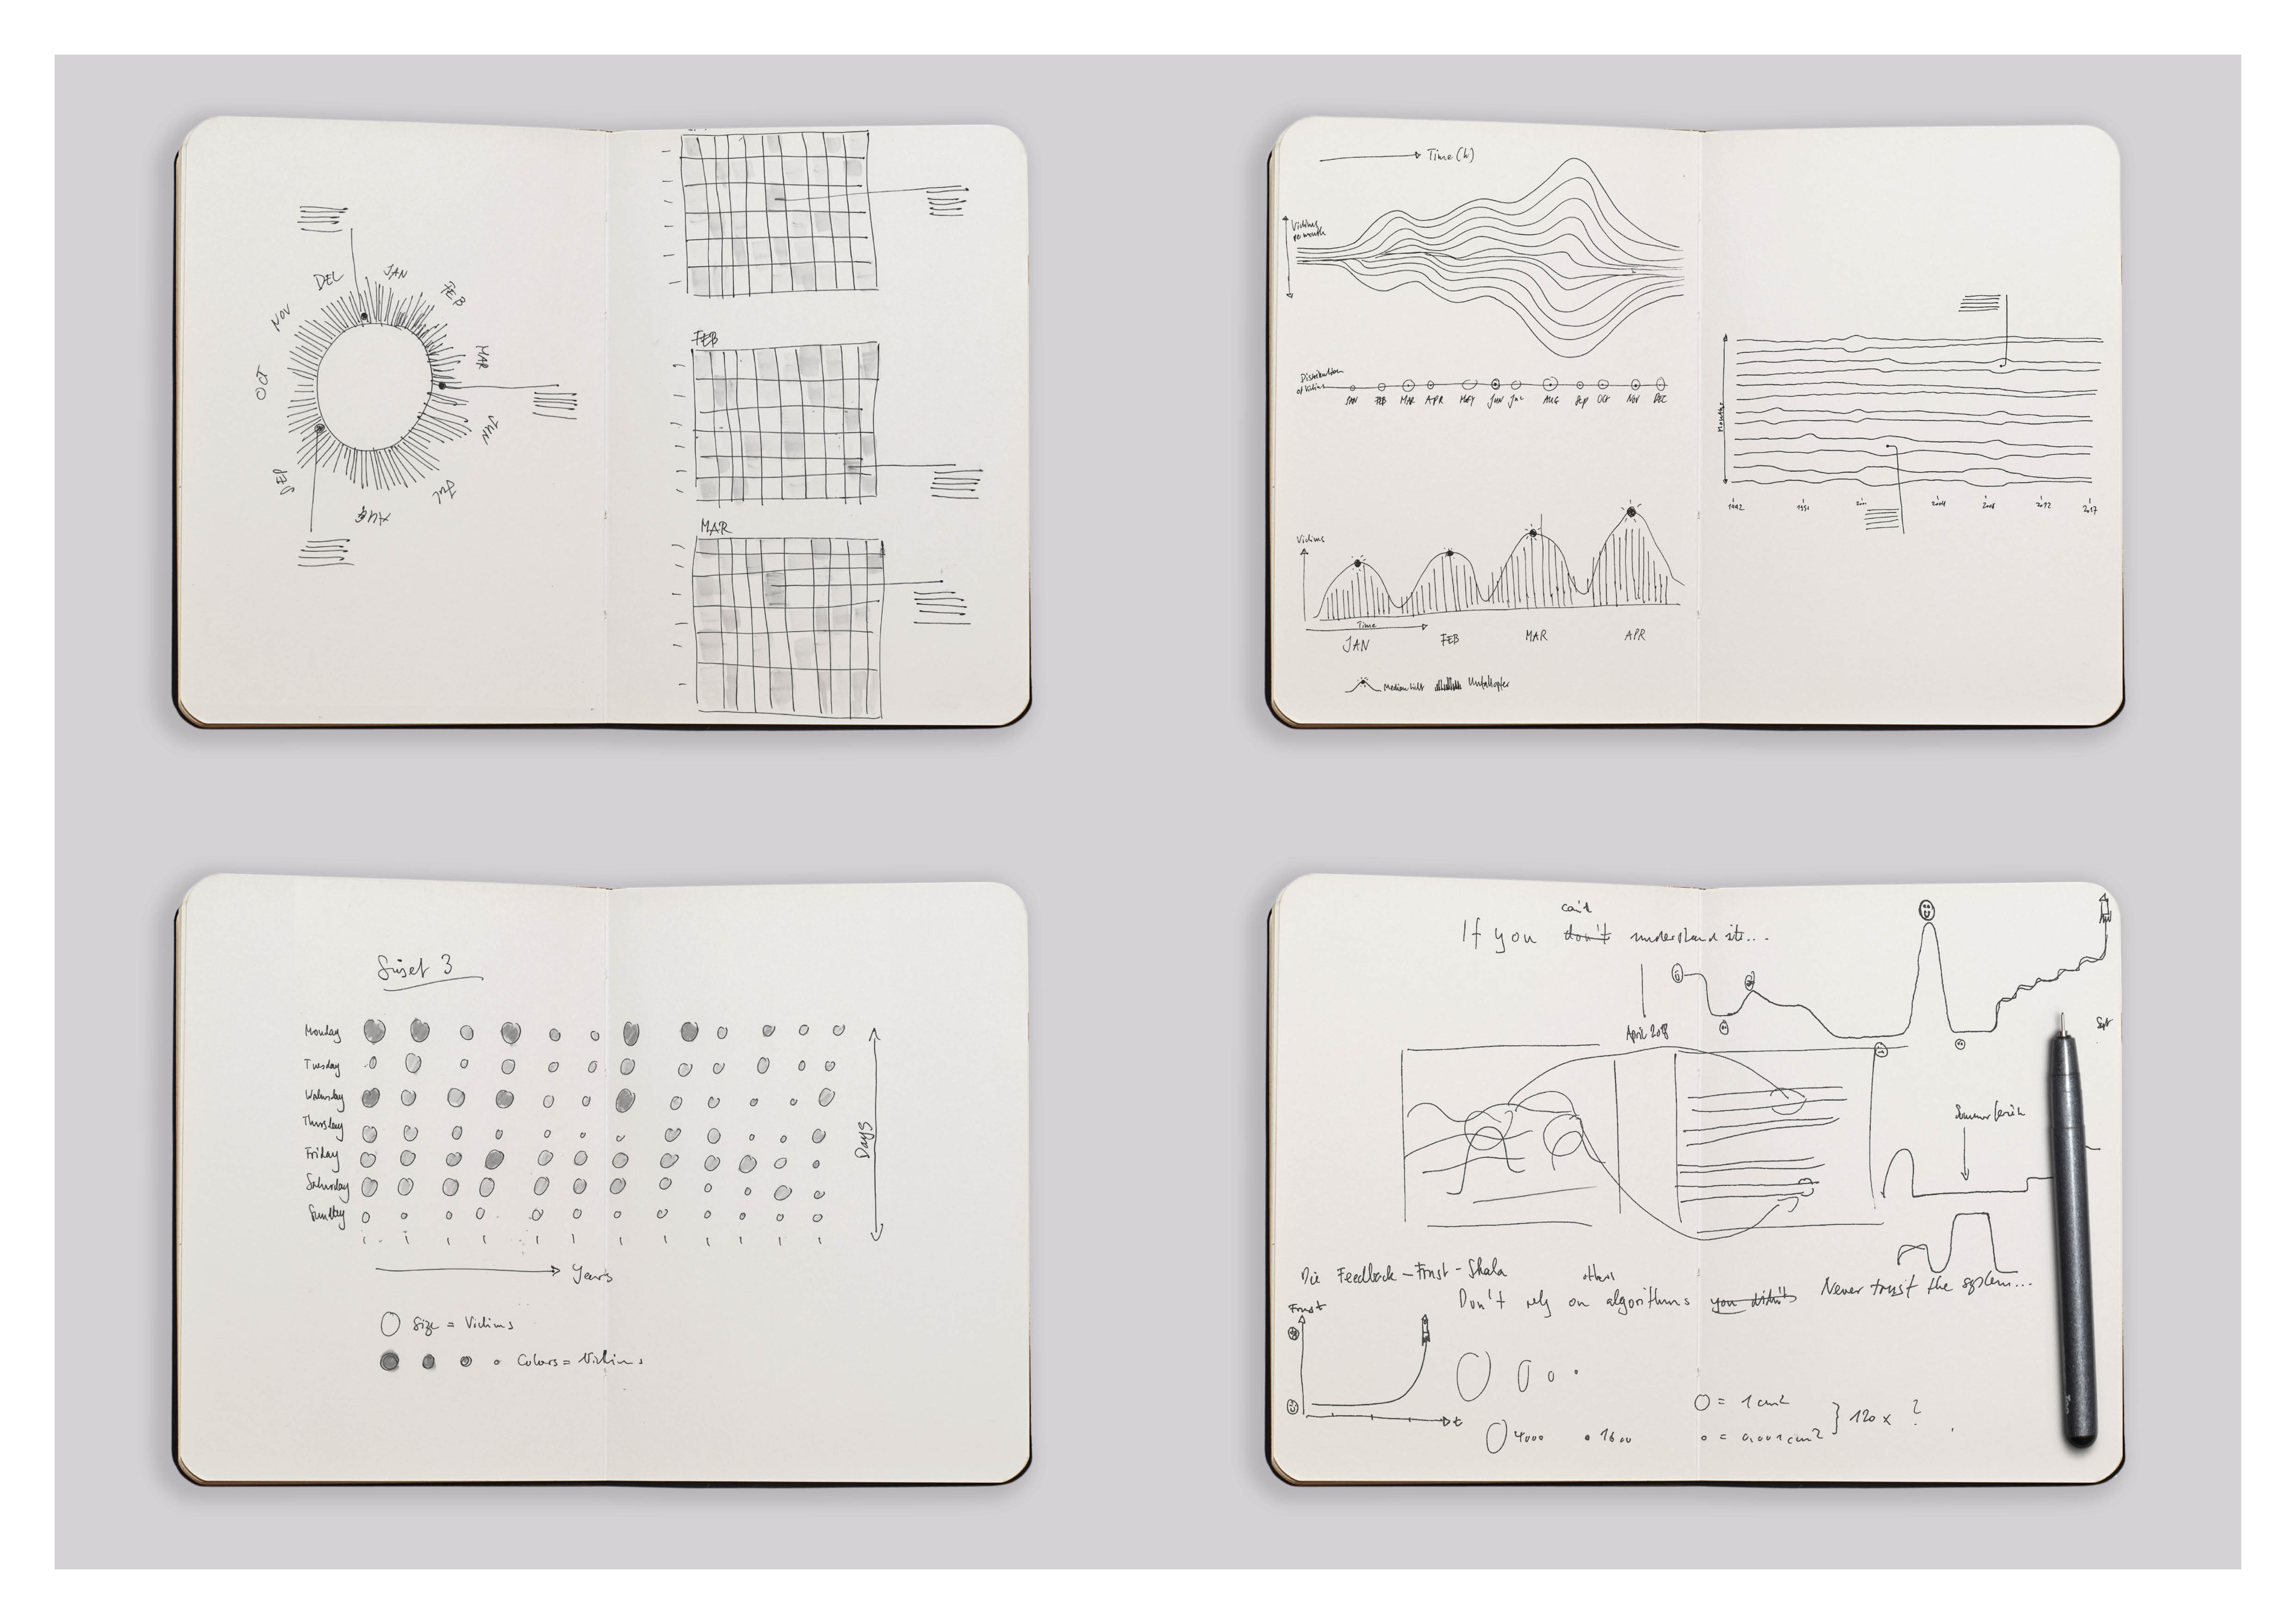
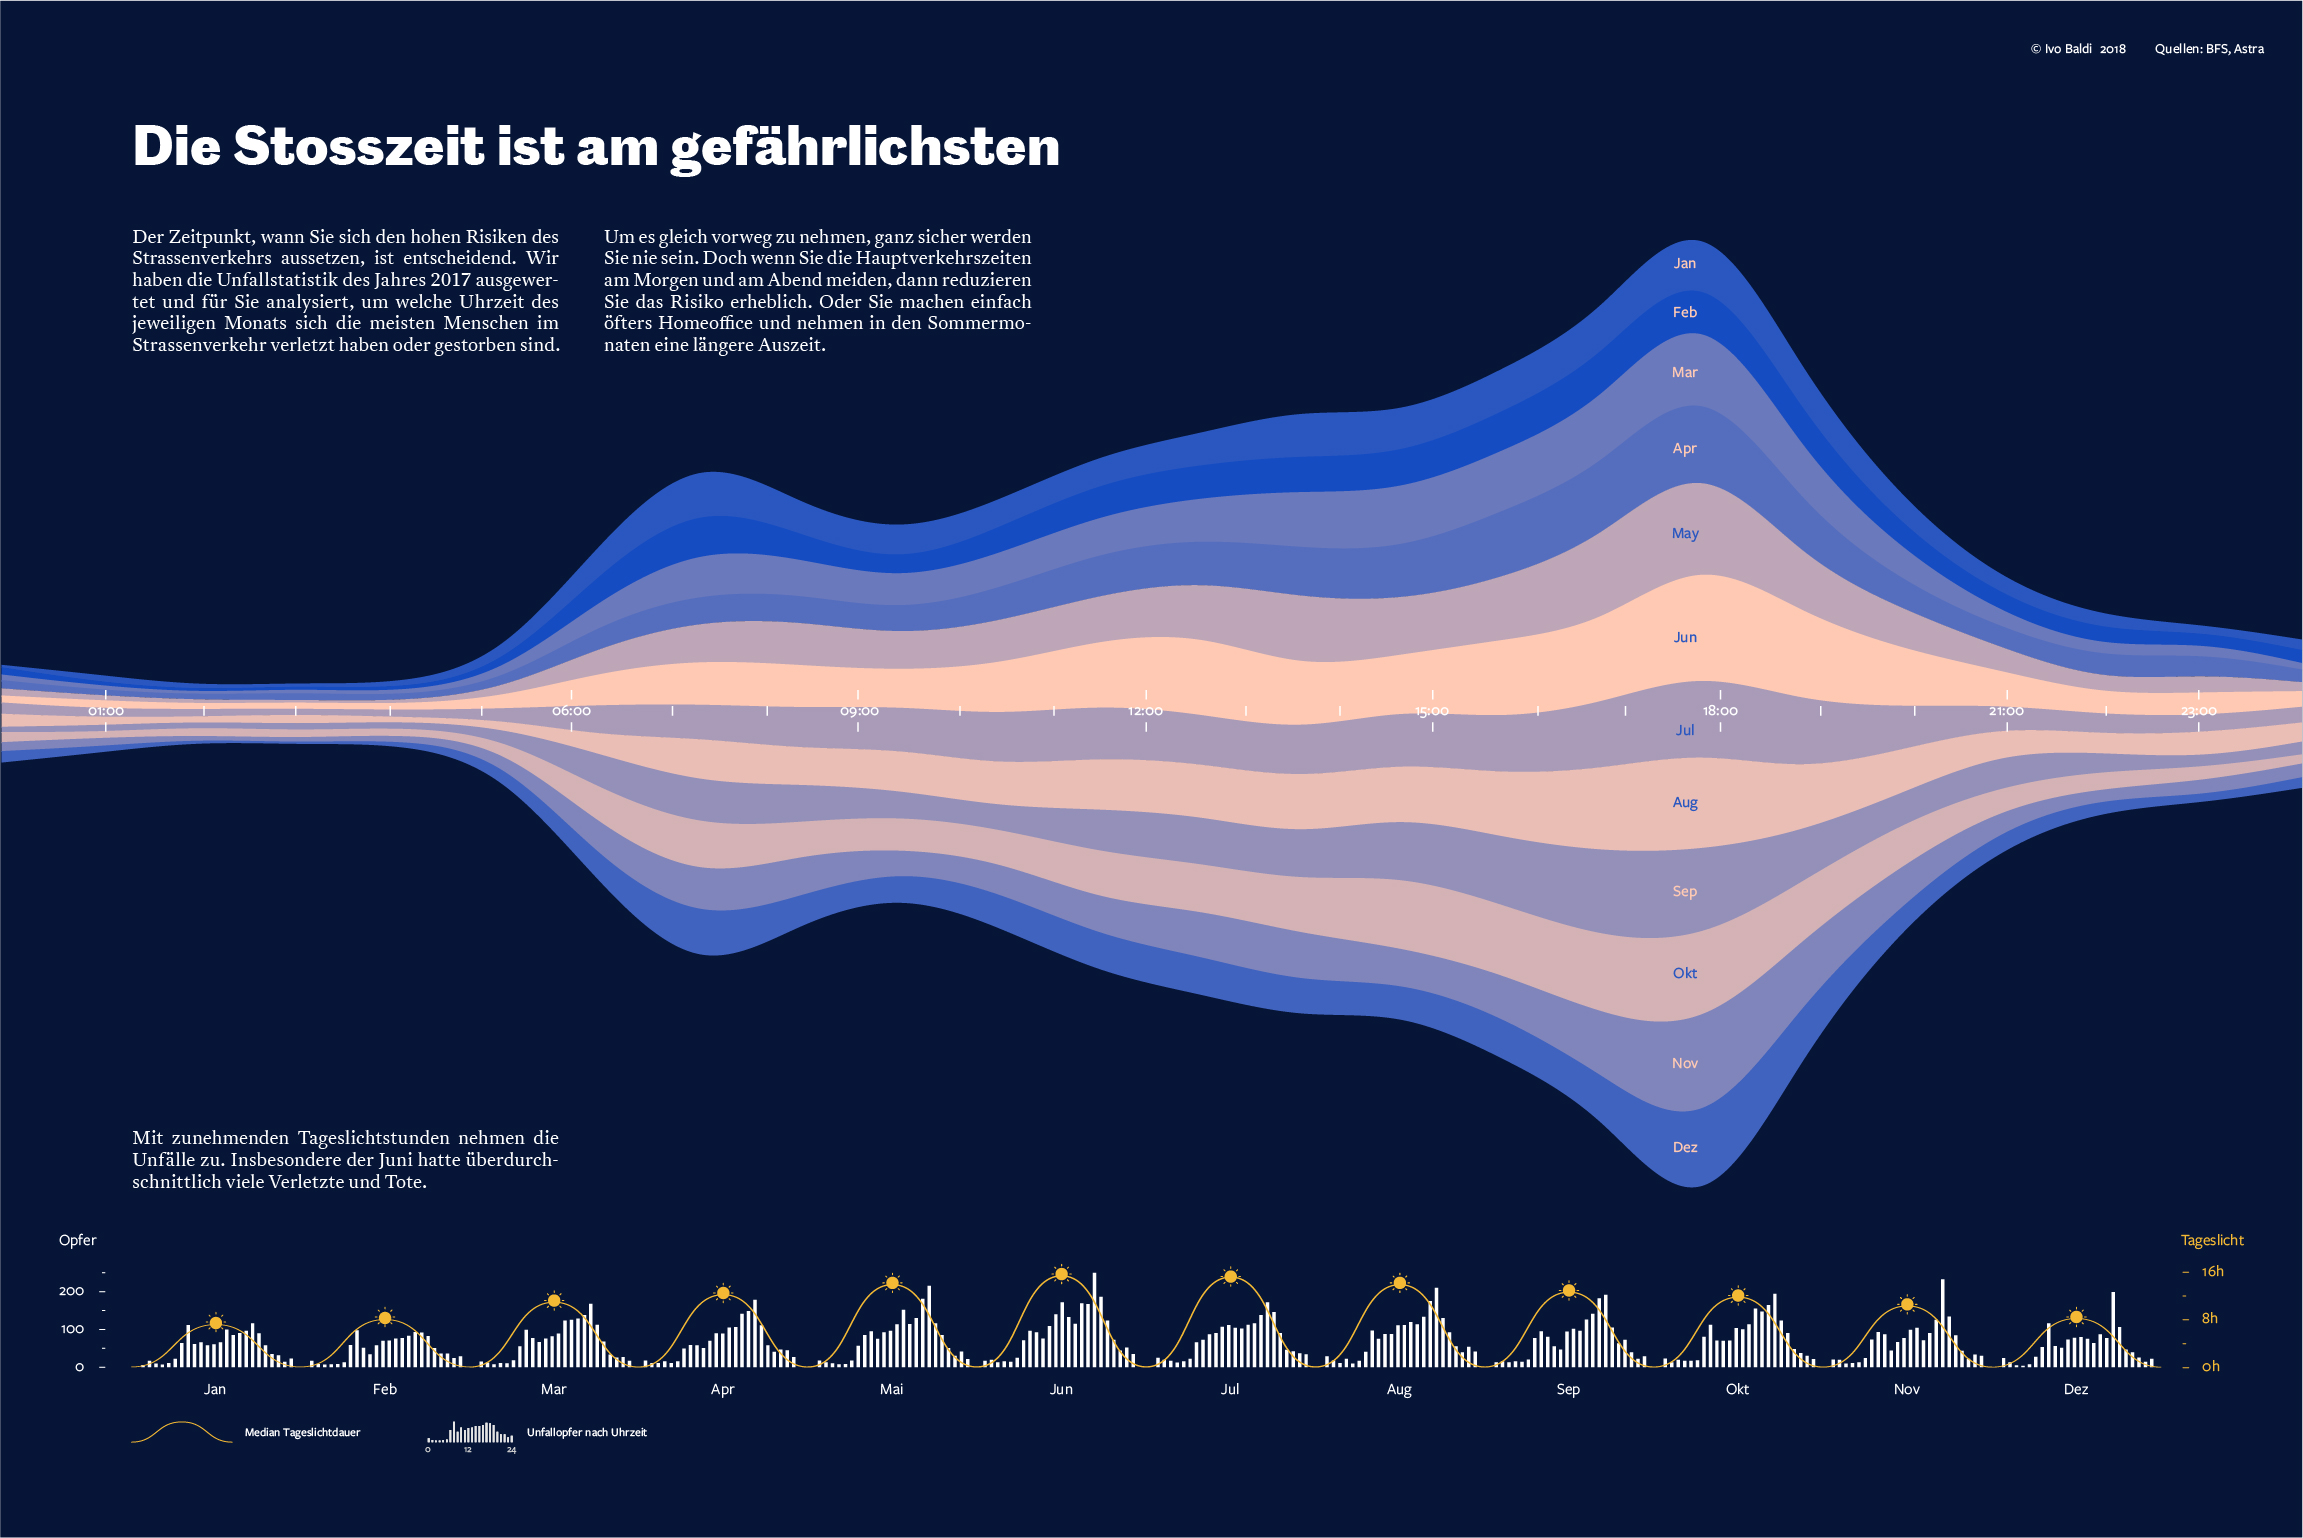
I decided to visualize data of traffic accidents. My goal was to create unconventional and aesthetically pleasing visualizations showing the development of traffic accidents over the last 25 years.
I analyzed different aspects of the accidents like number, distribution, development and visualized them with different time focus (hours/days/months/years).
By adding explorative elements, the reader is encouraged to dive into the visualizations and discover interesting patterns.
The visualizations are aimed at magazine readers. The target group and the medium were chosen because this reader needs more time to read than the daily newspaper reader. I used this greater scope for creative implementation.
During my studies in data visualization at the Bern University of Applied Sciences, we were commisioned to carry out a project during our studies.
I decided to visualize data from traffic accidents. My goal was to design some unconventional, aesthetically pleasing visualizations to show the development of road accidents of the last 25 years.
I have analyzed various aspects of the accidents like numbers, distribution, development and visualized them with a different time focus (hours/days/months/years).
By adding explorative elements, the reader should be encouraged to delve into the visualizations and discover interesting patterns.
The visualizations focus on magazine readers. The target group and the medium were chosen because these readers, in contrast to the daily newspaper reader, have more tie to read. I used this greater playground for the creative implementation.


Selected Works

PyreneDesign System
Data PlatformBranding / Logotype

25 Years of Traffic AccidentsData Visualization
Dashboards & GraphsUser Interface
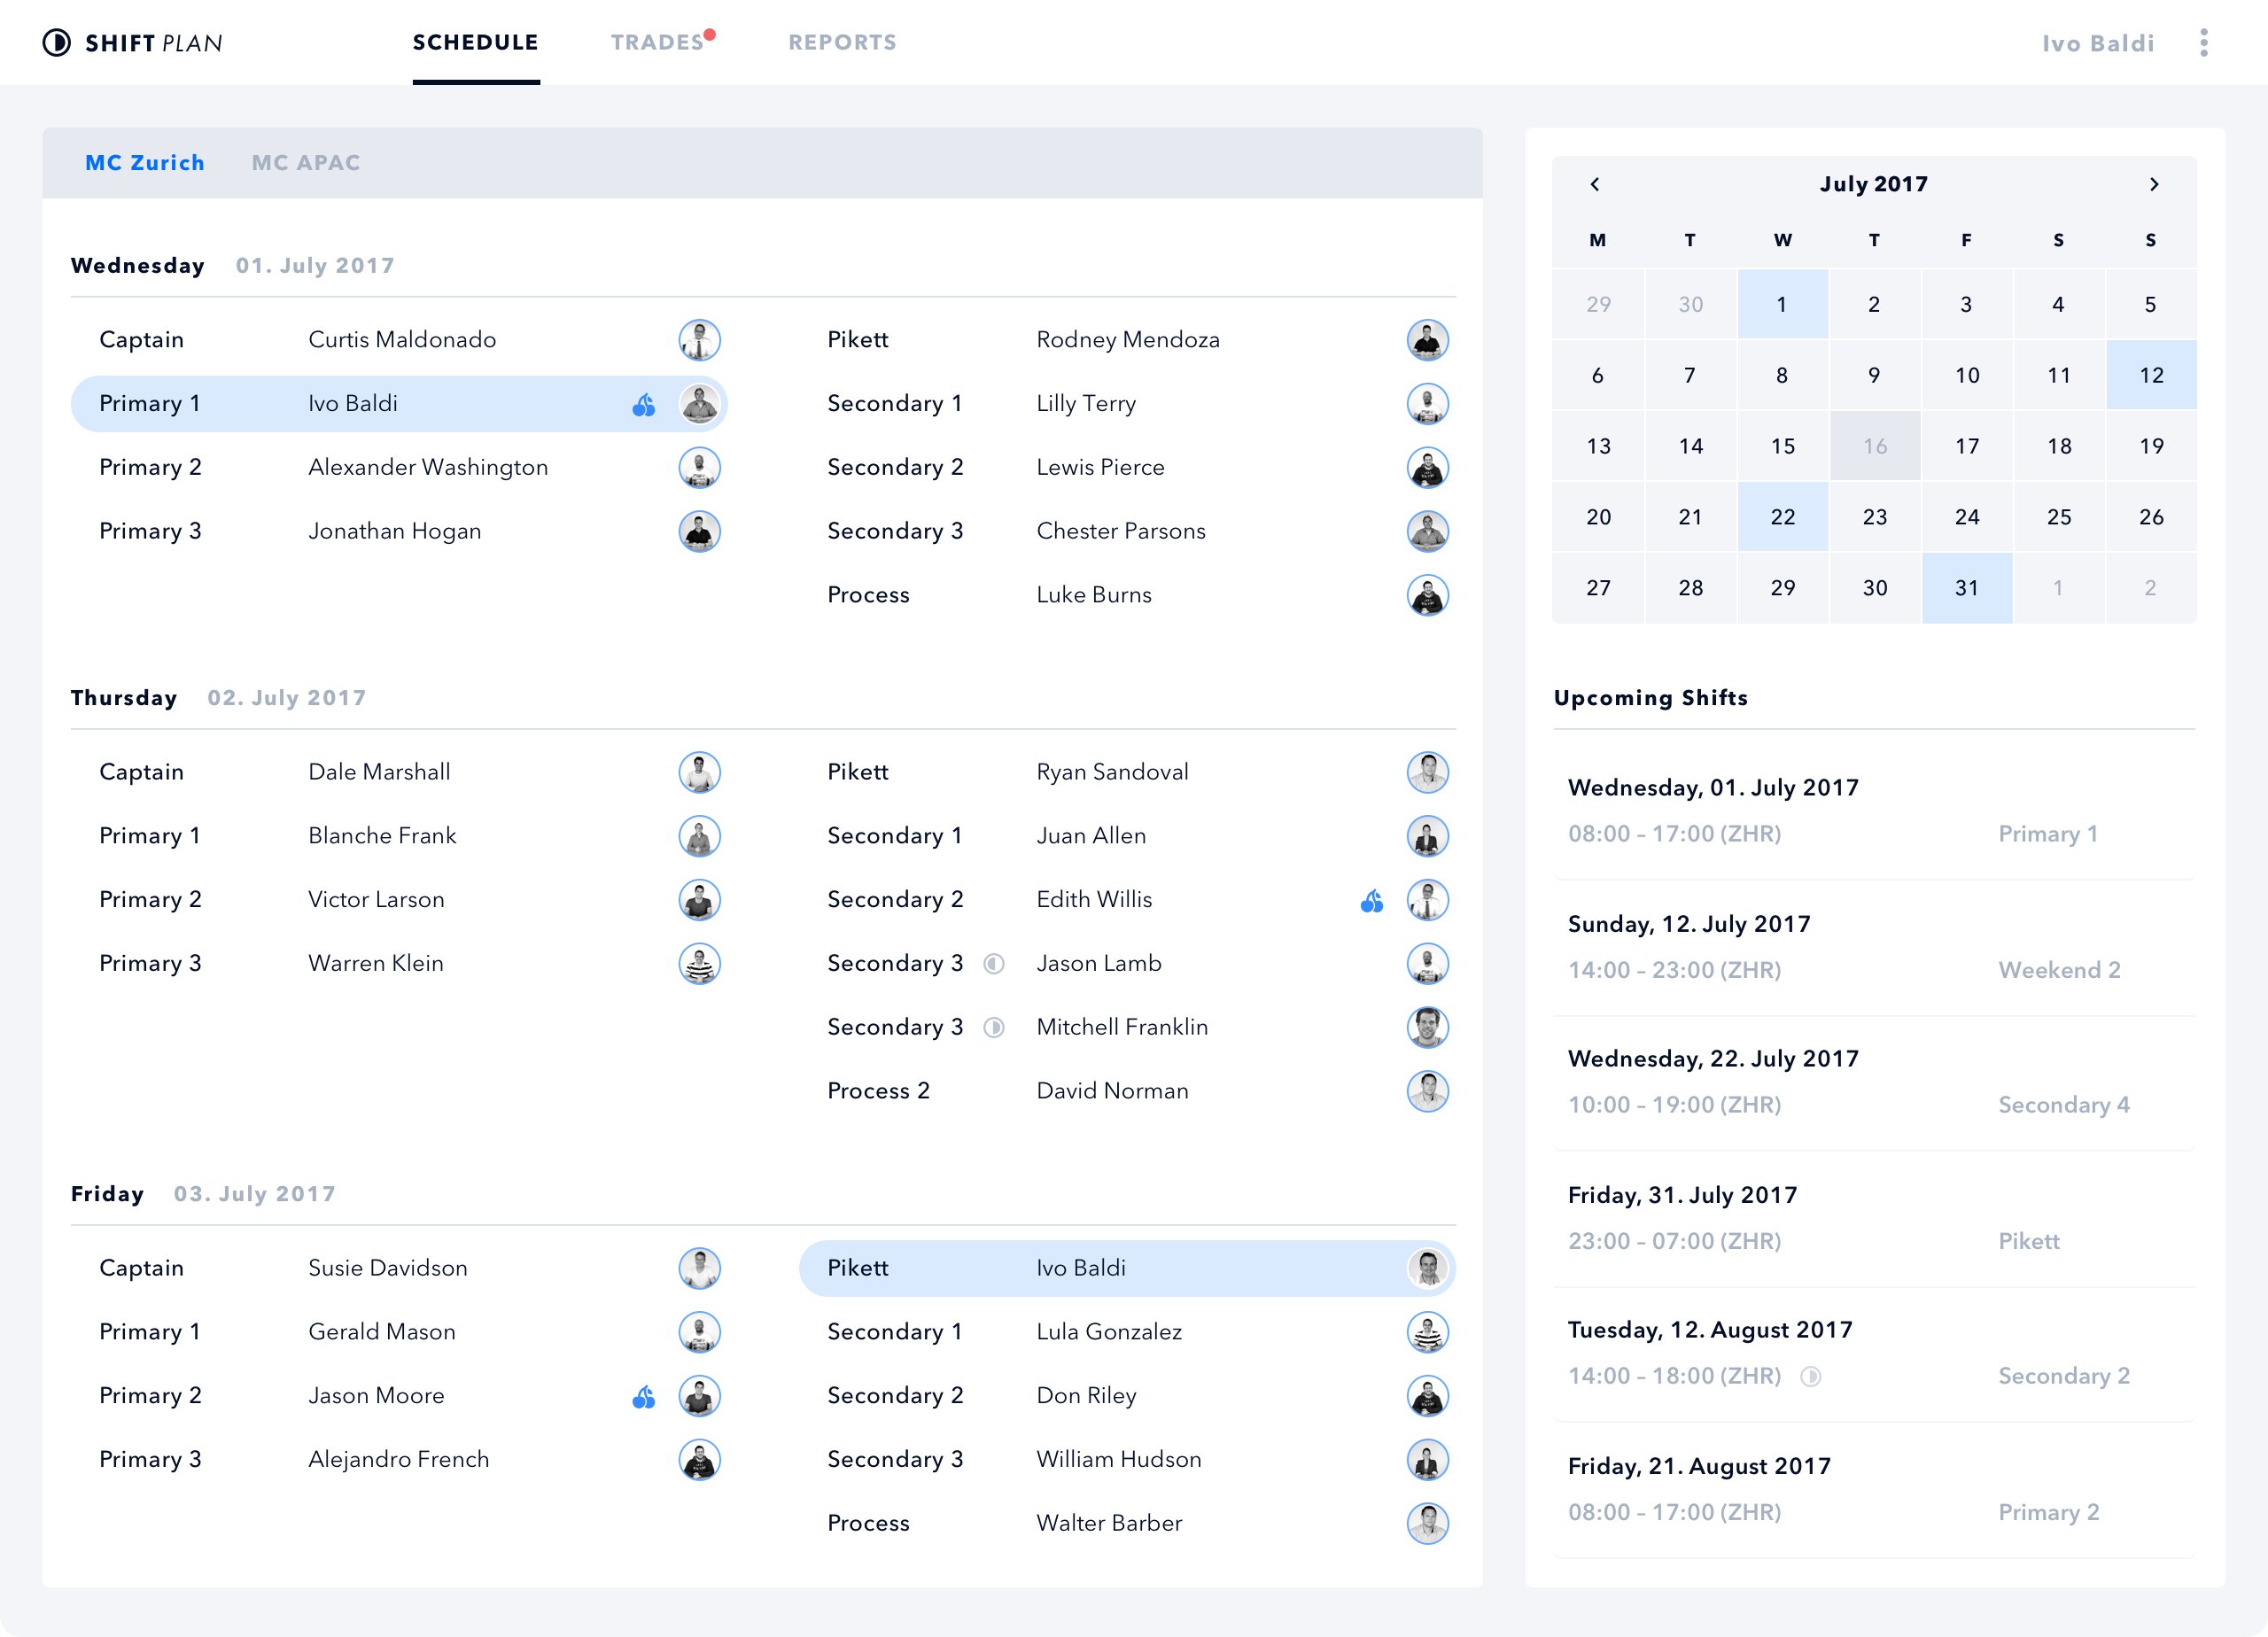
Shift PlanUser Interface
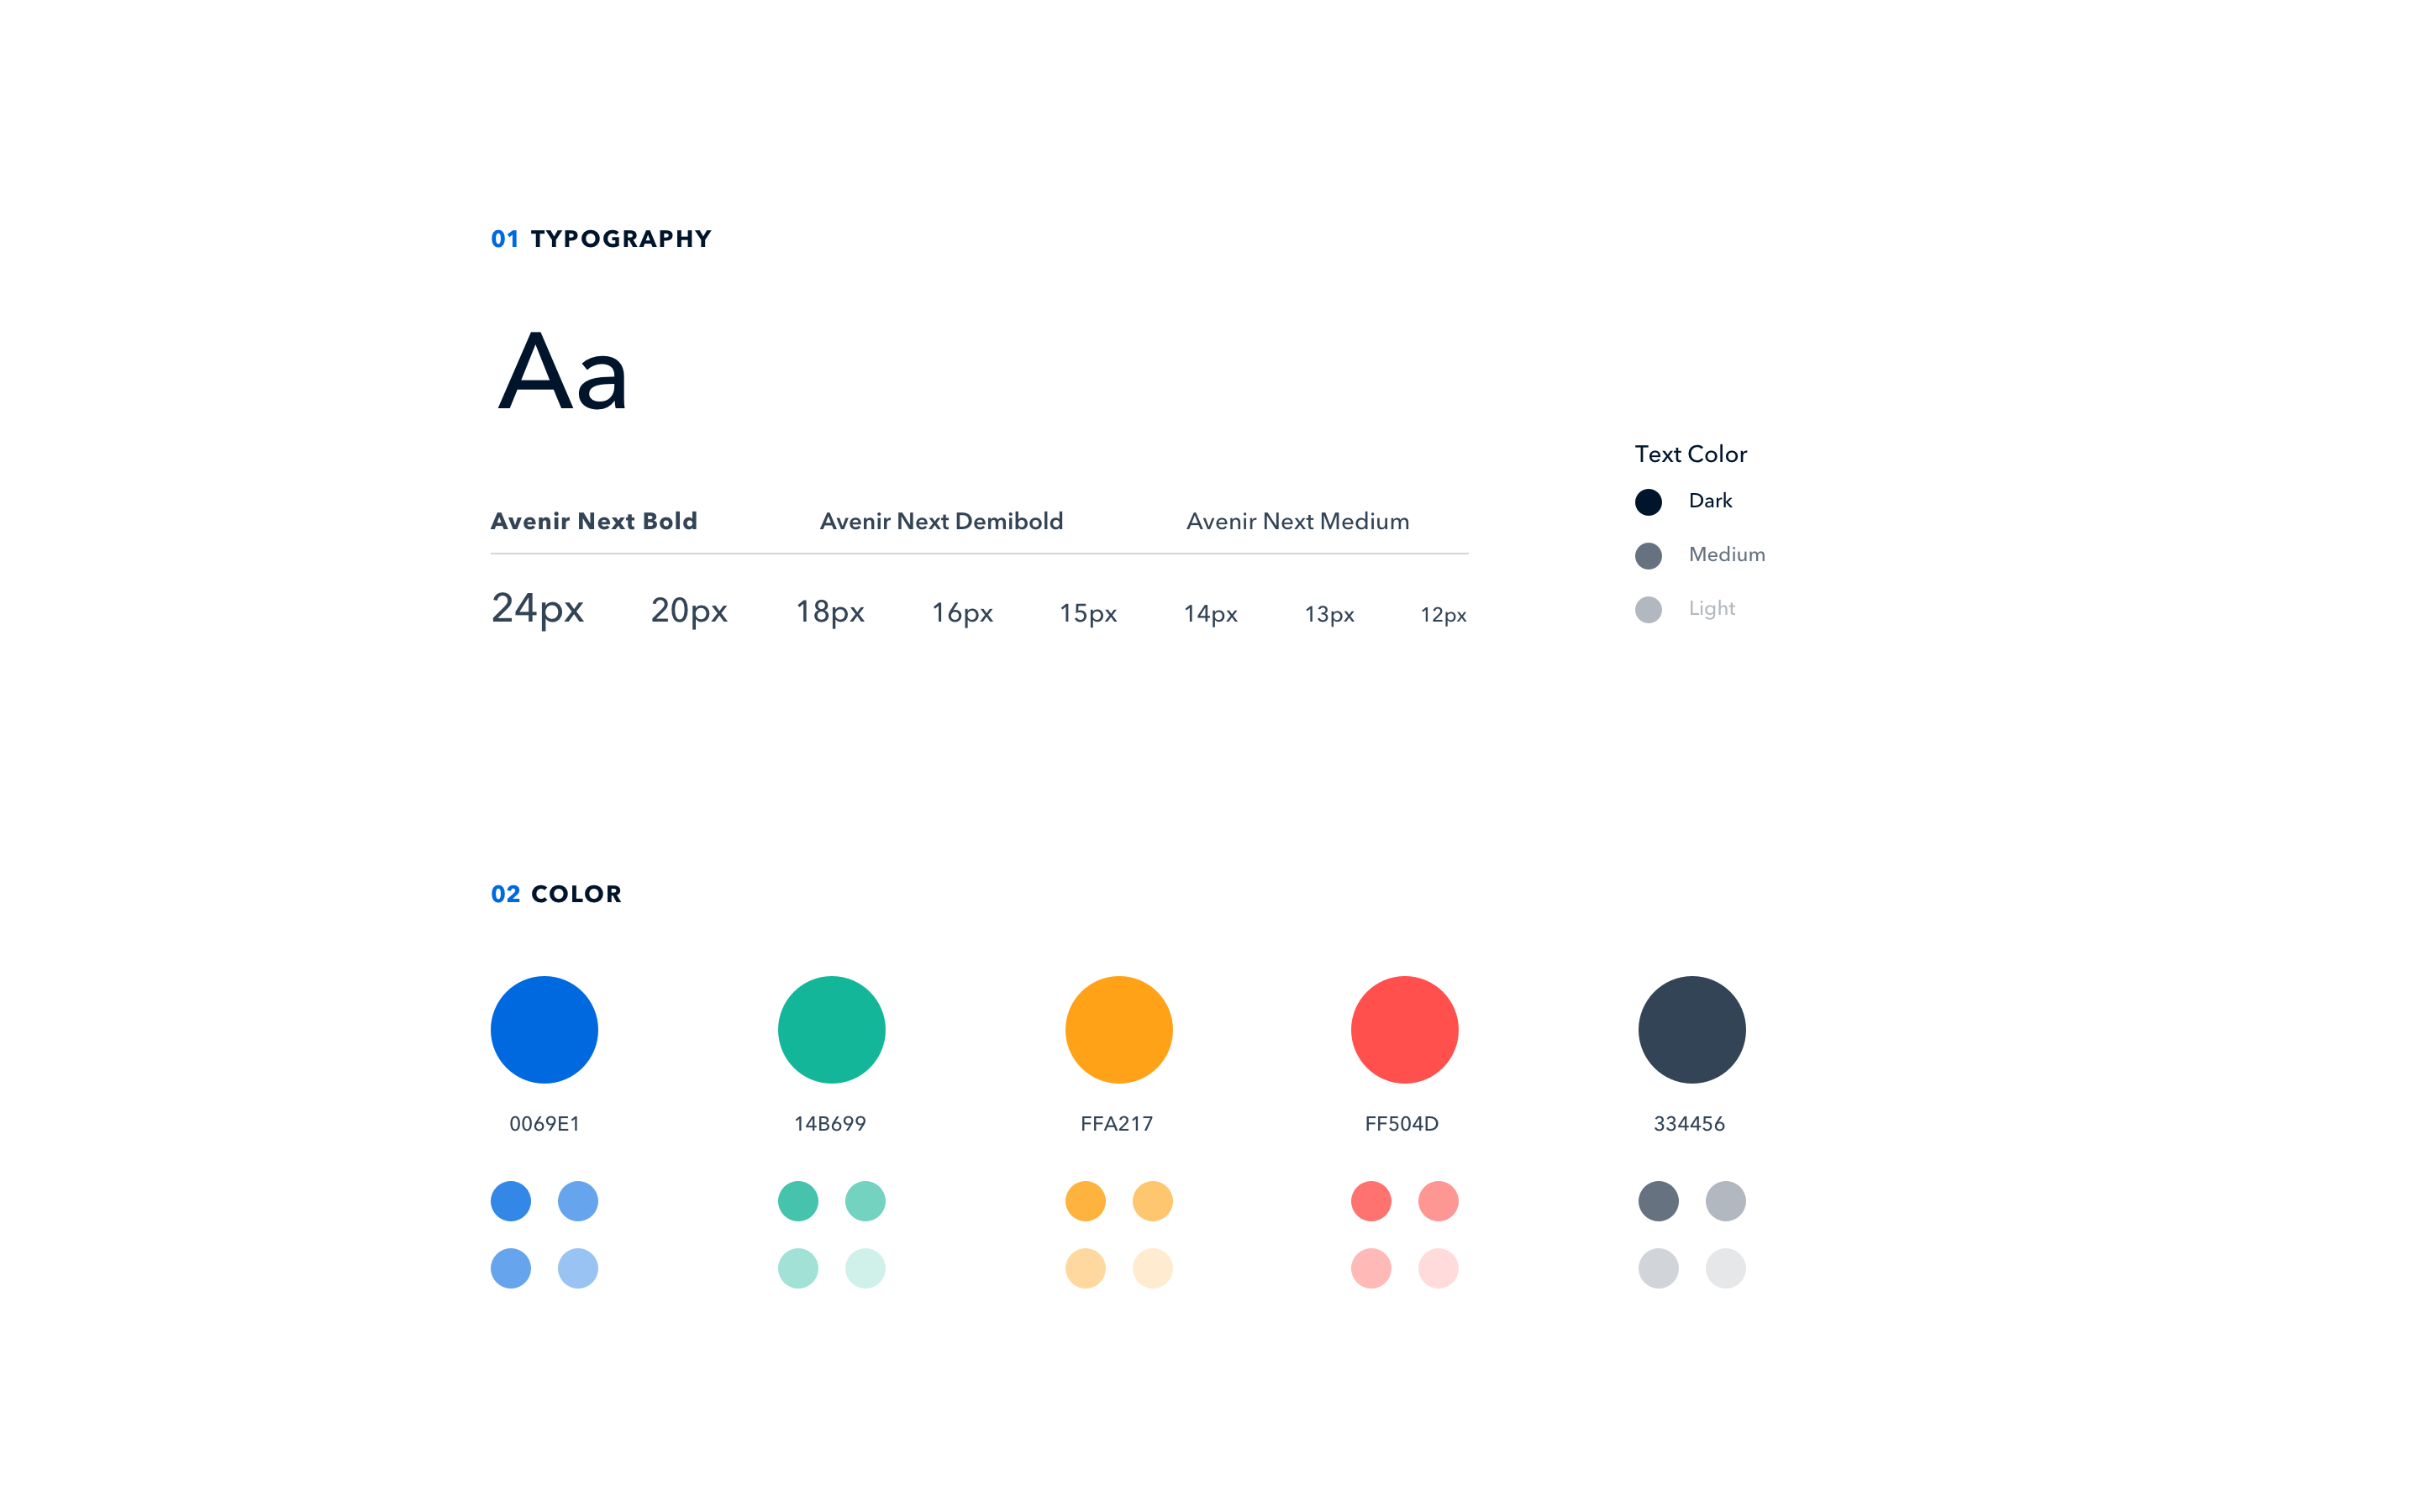
Design SystemUser Interface