Dashboards & Graphs
User Interface
Dashboards & Graphs
User Interface
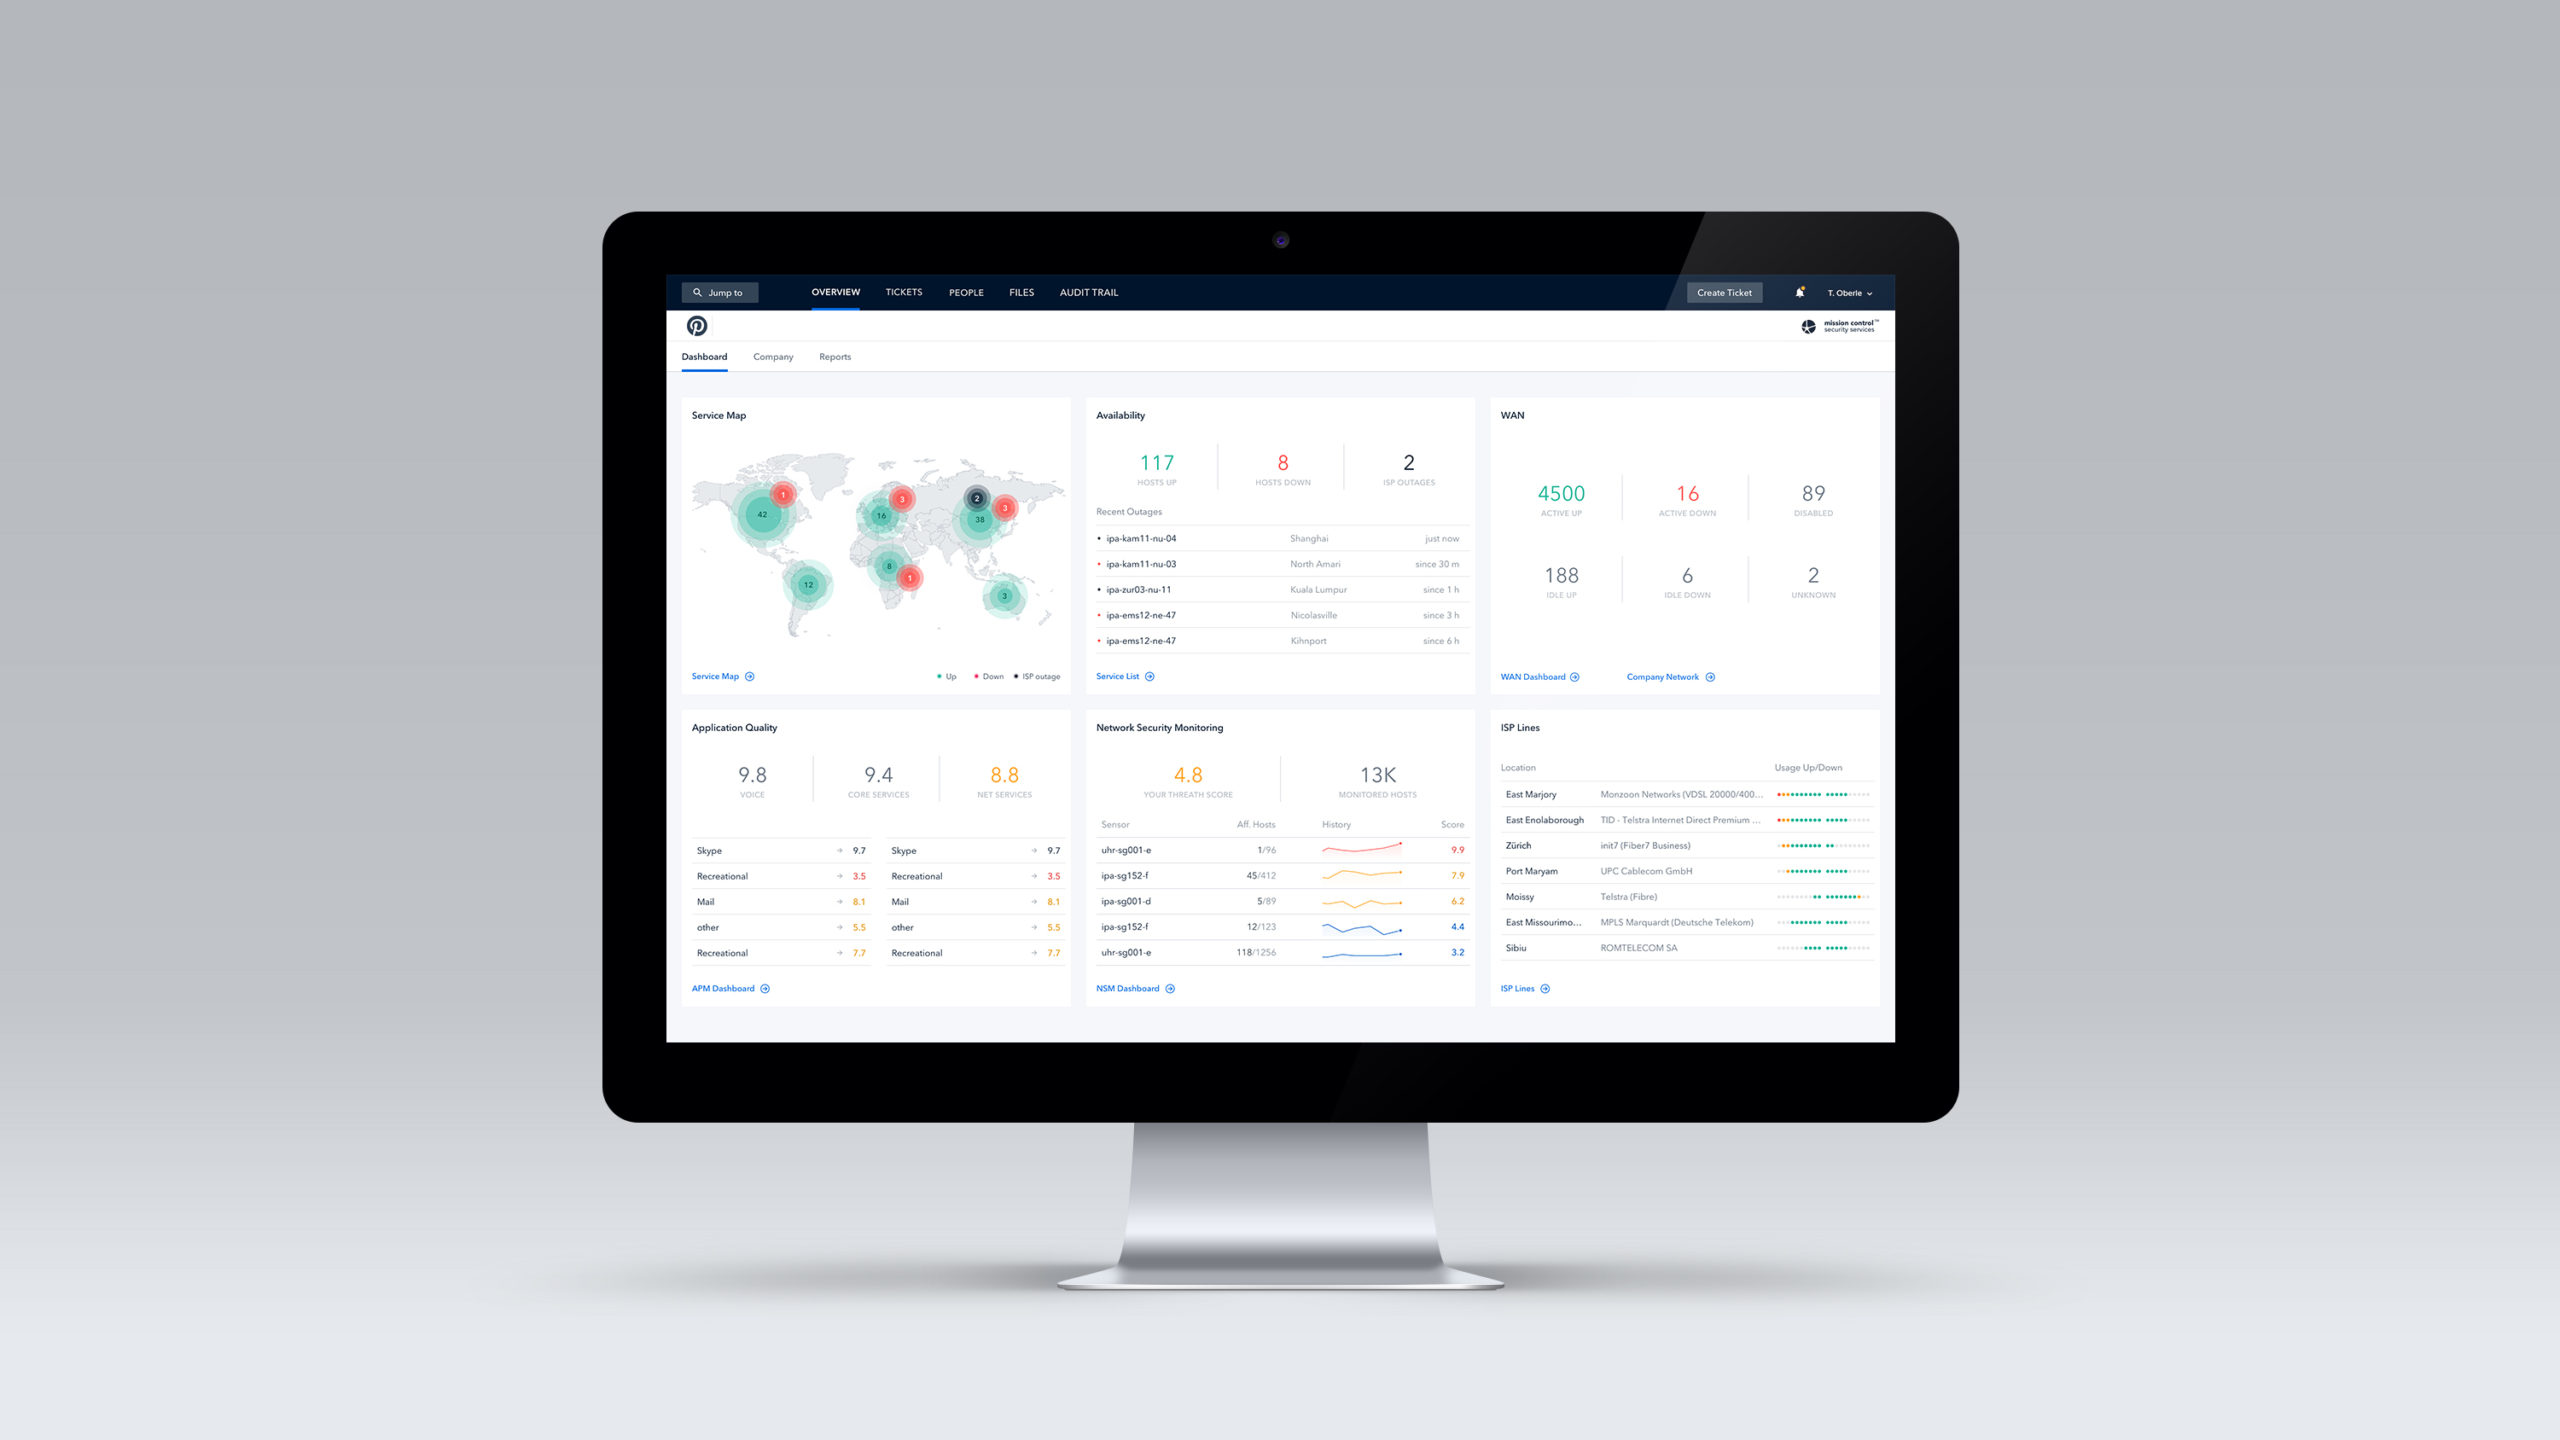
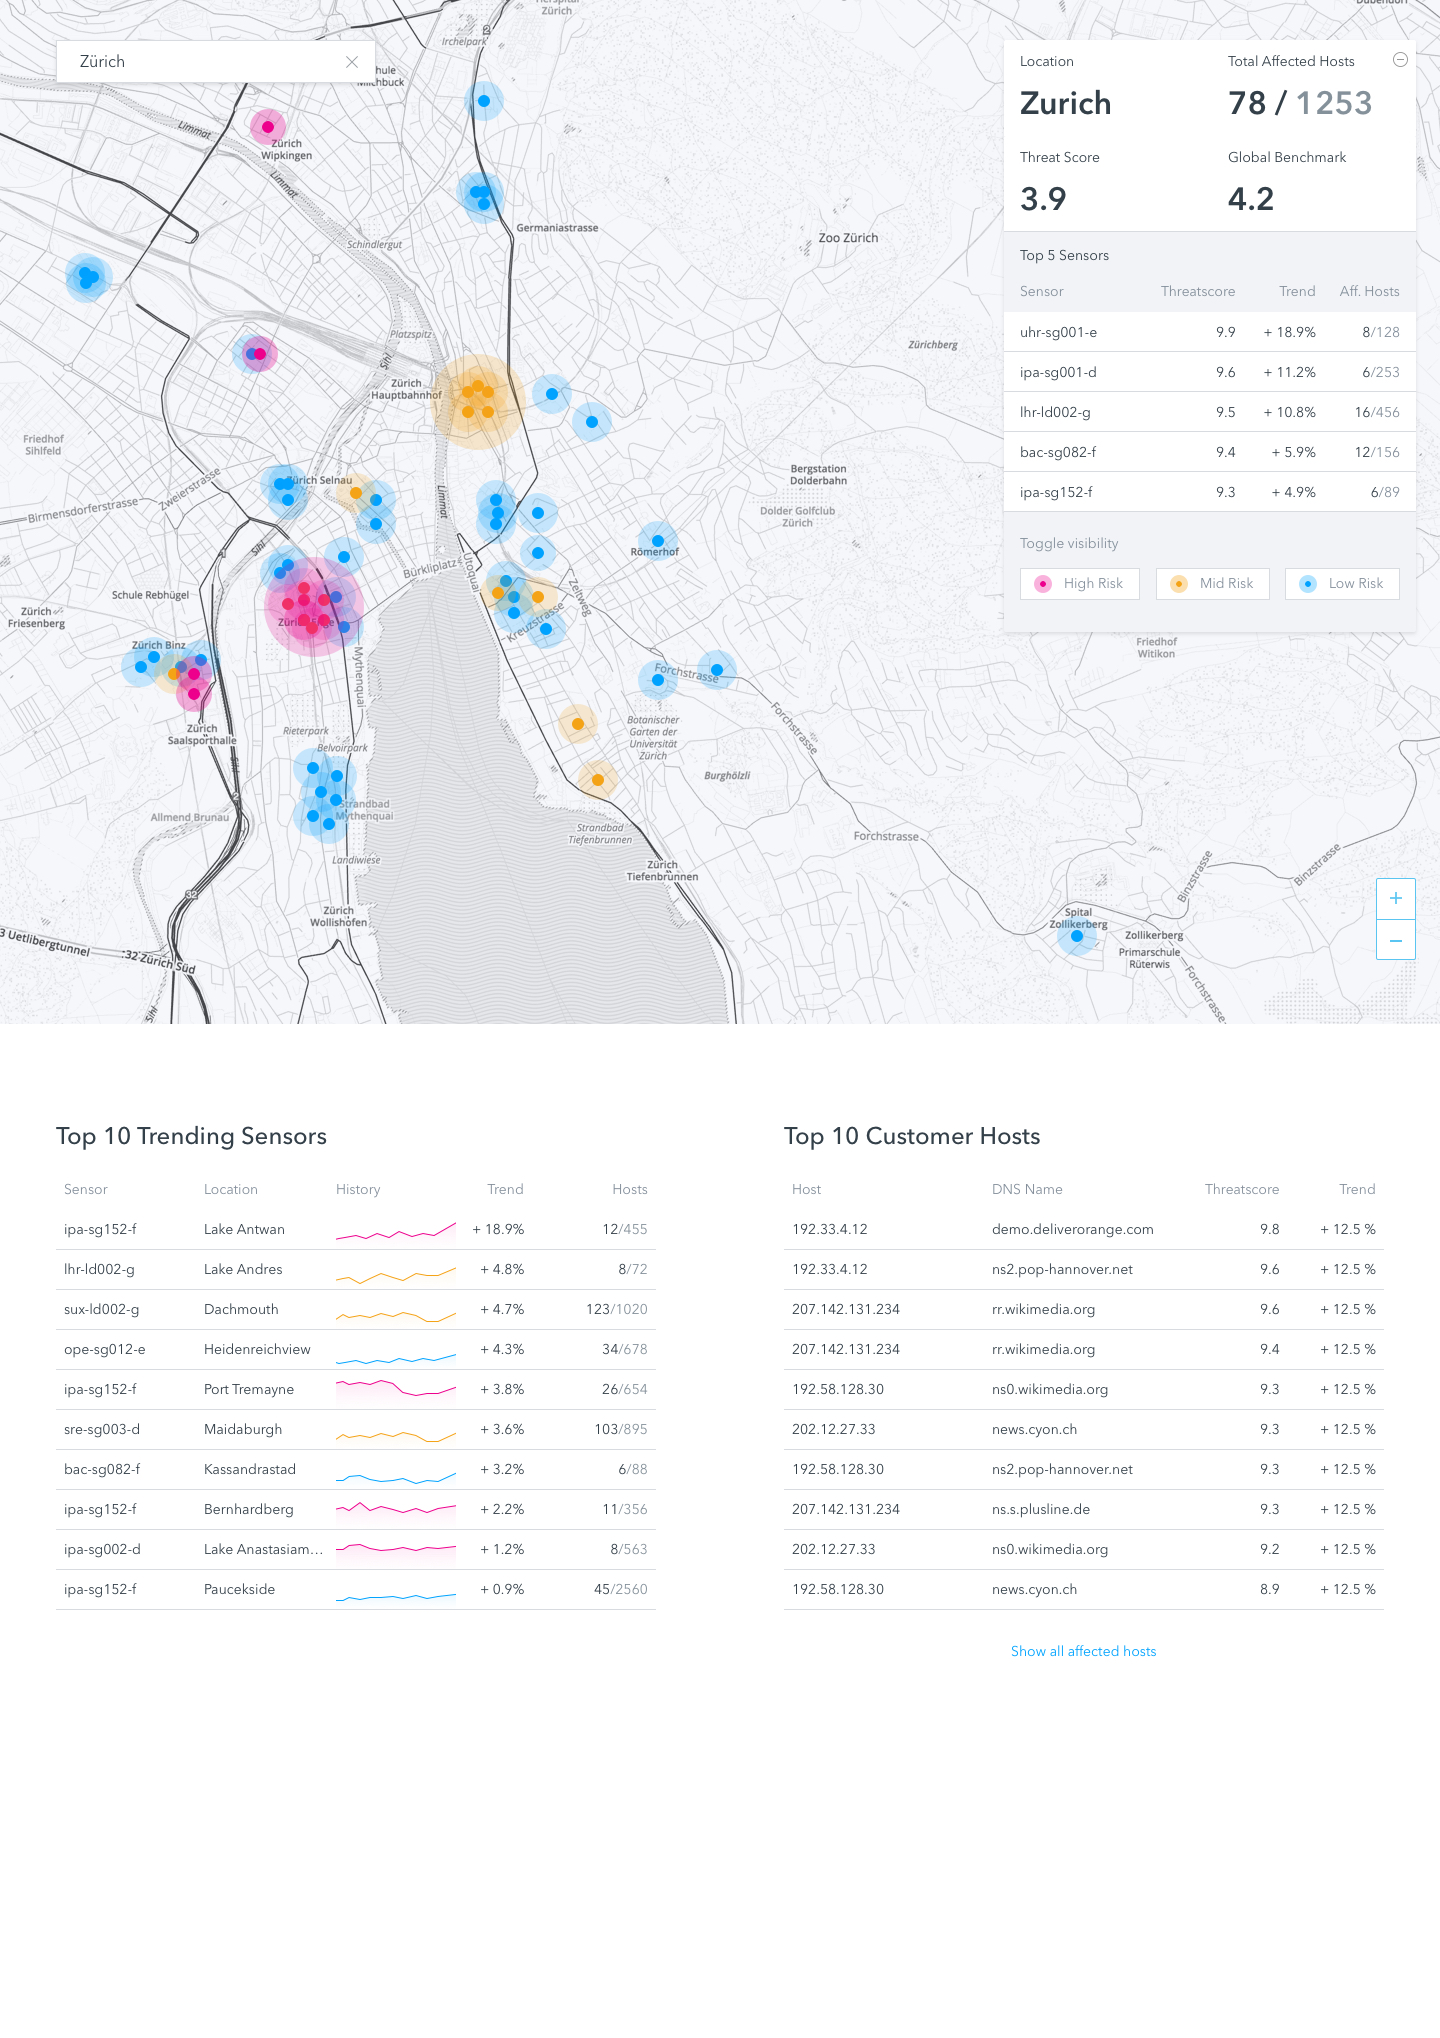
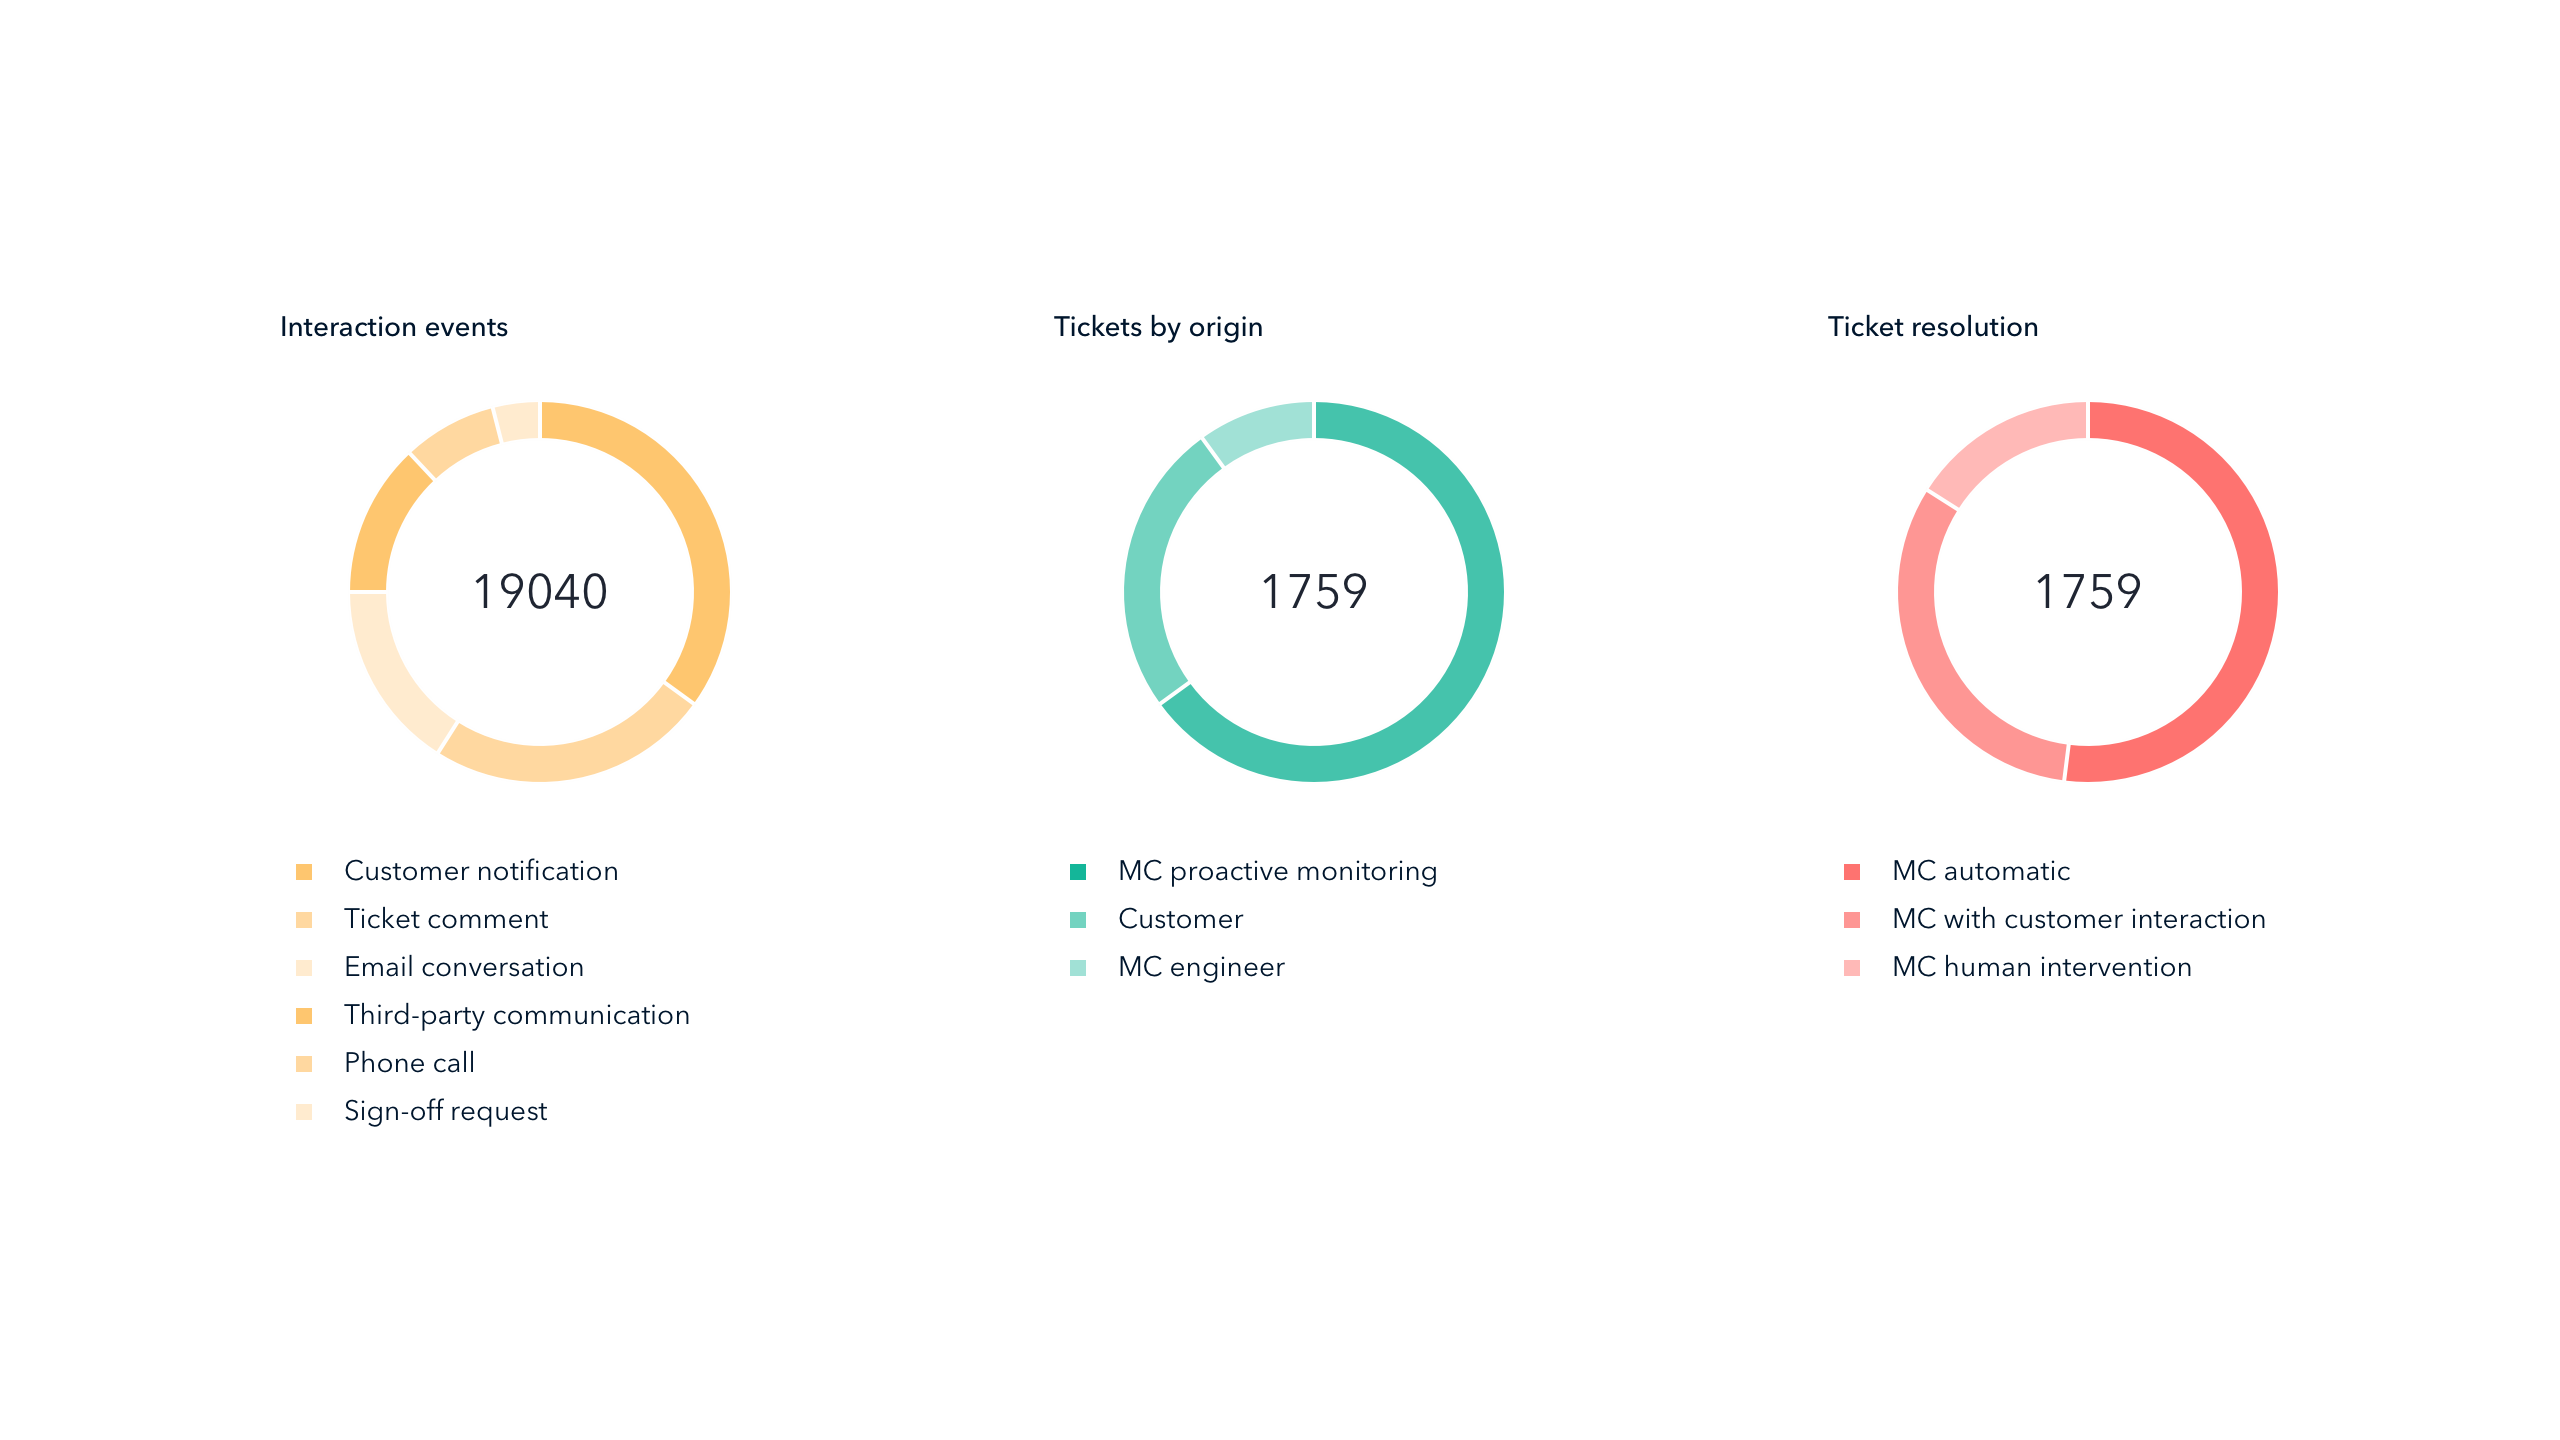
The Mission Control Portal provides transparency over the status of networks and applications in real-time, with reports and tools to support the implementation and management of global IT security and availability. Customers can see the status of their services at any time and analyze network performance fluctuations.
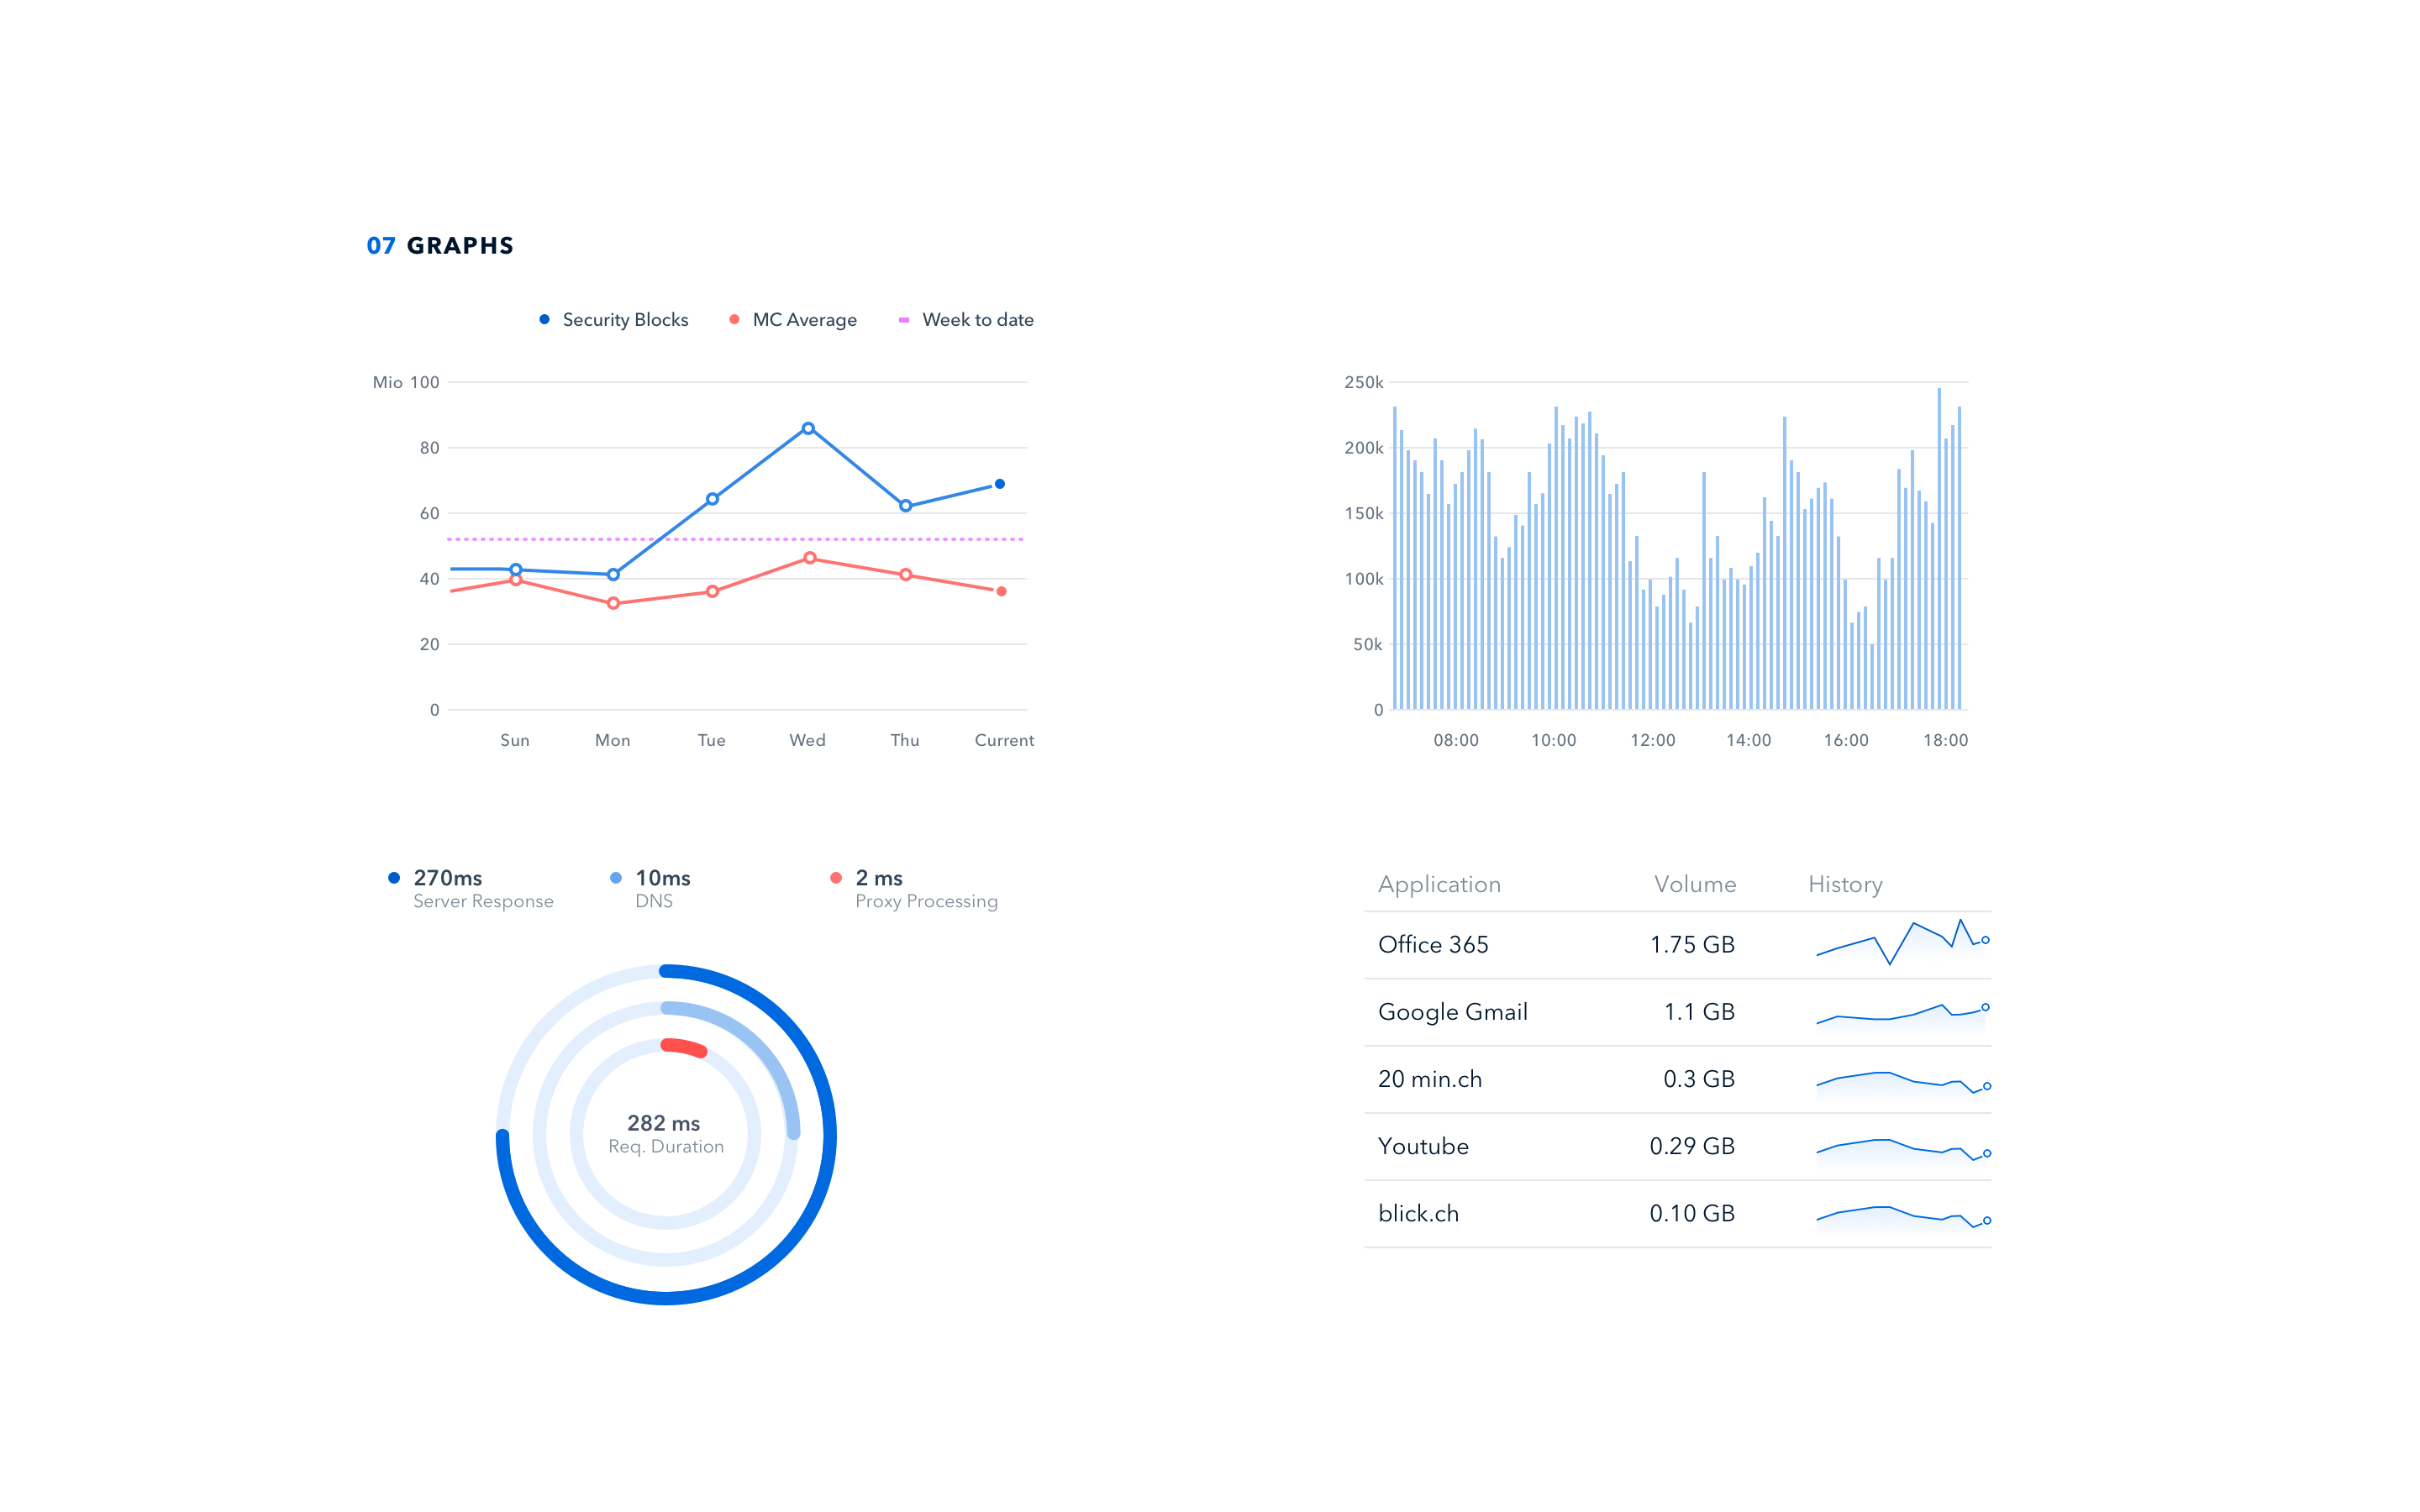
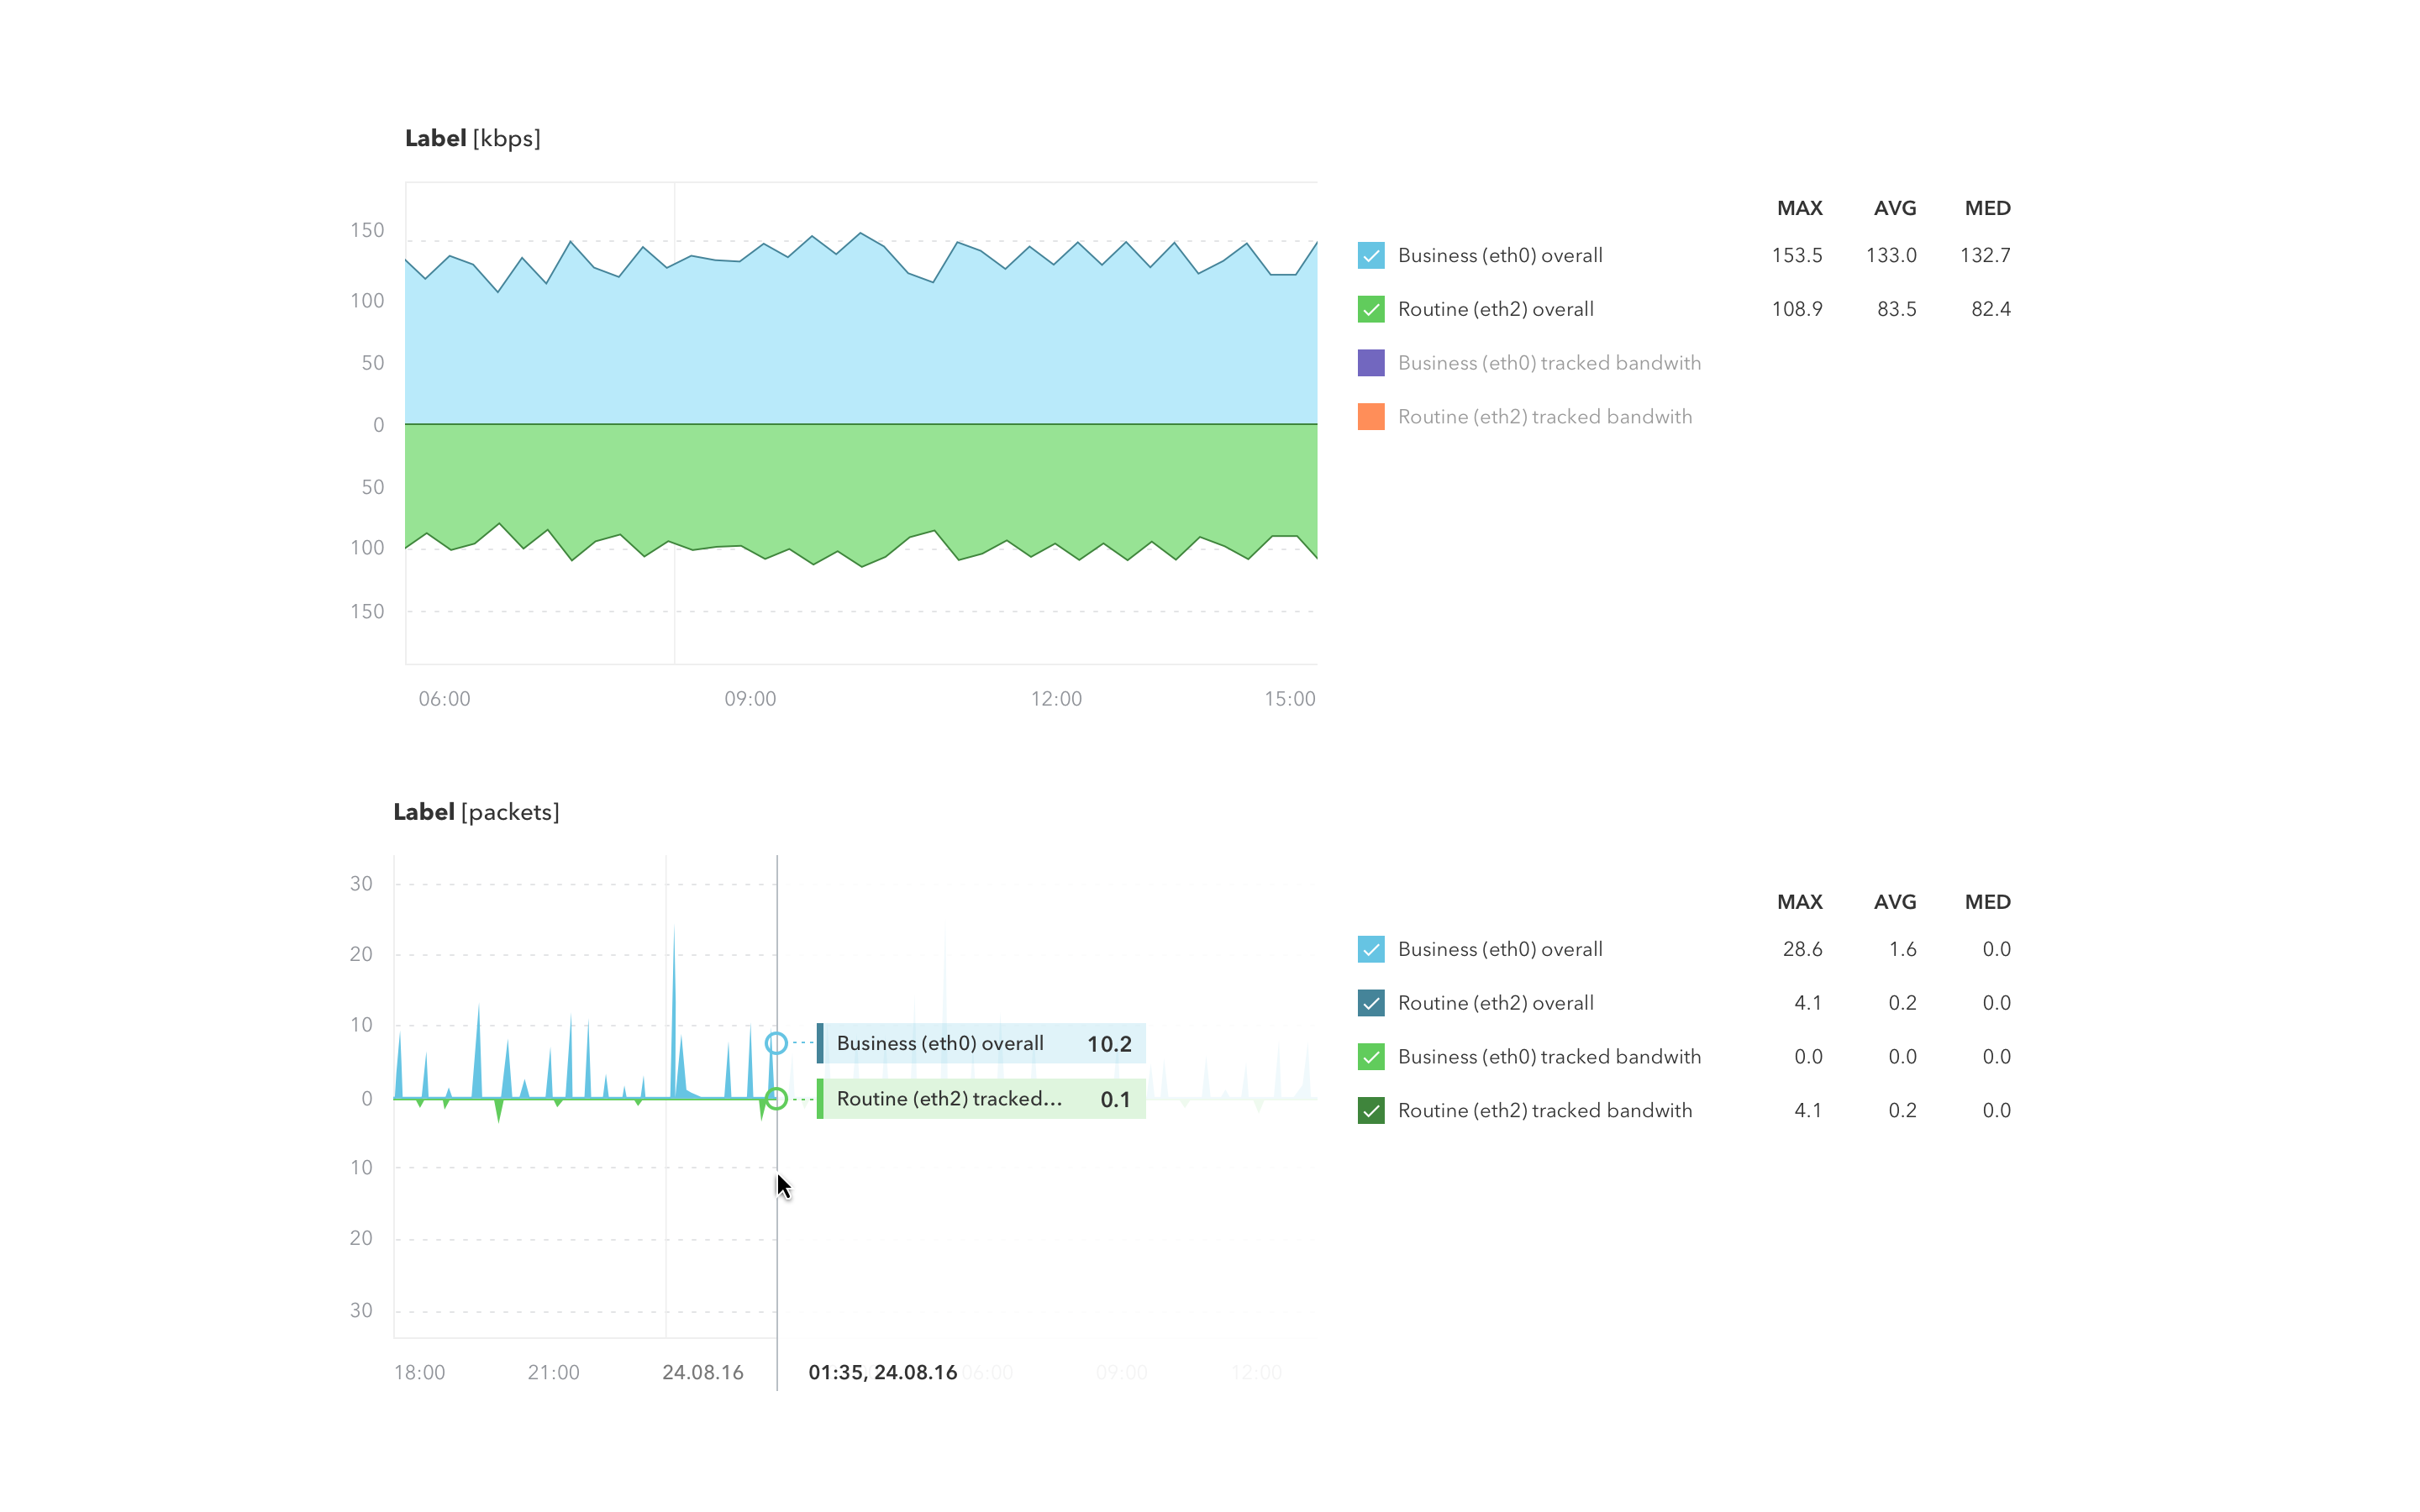
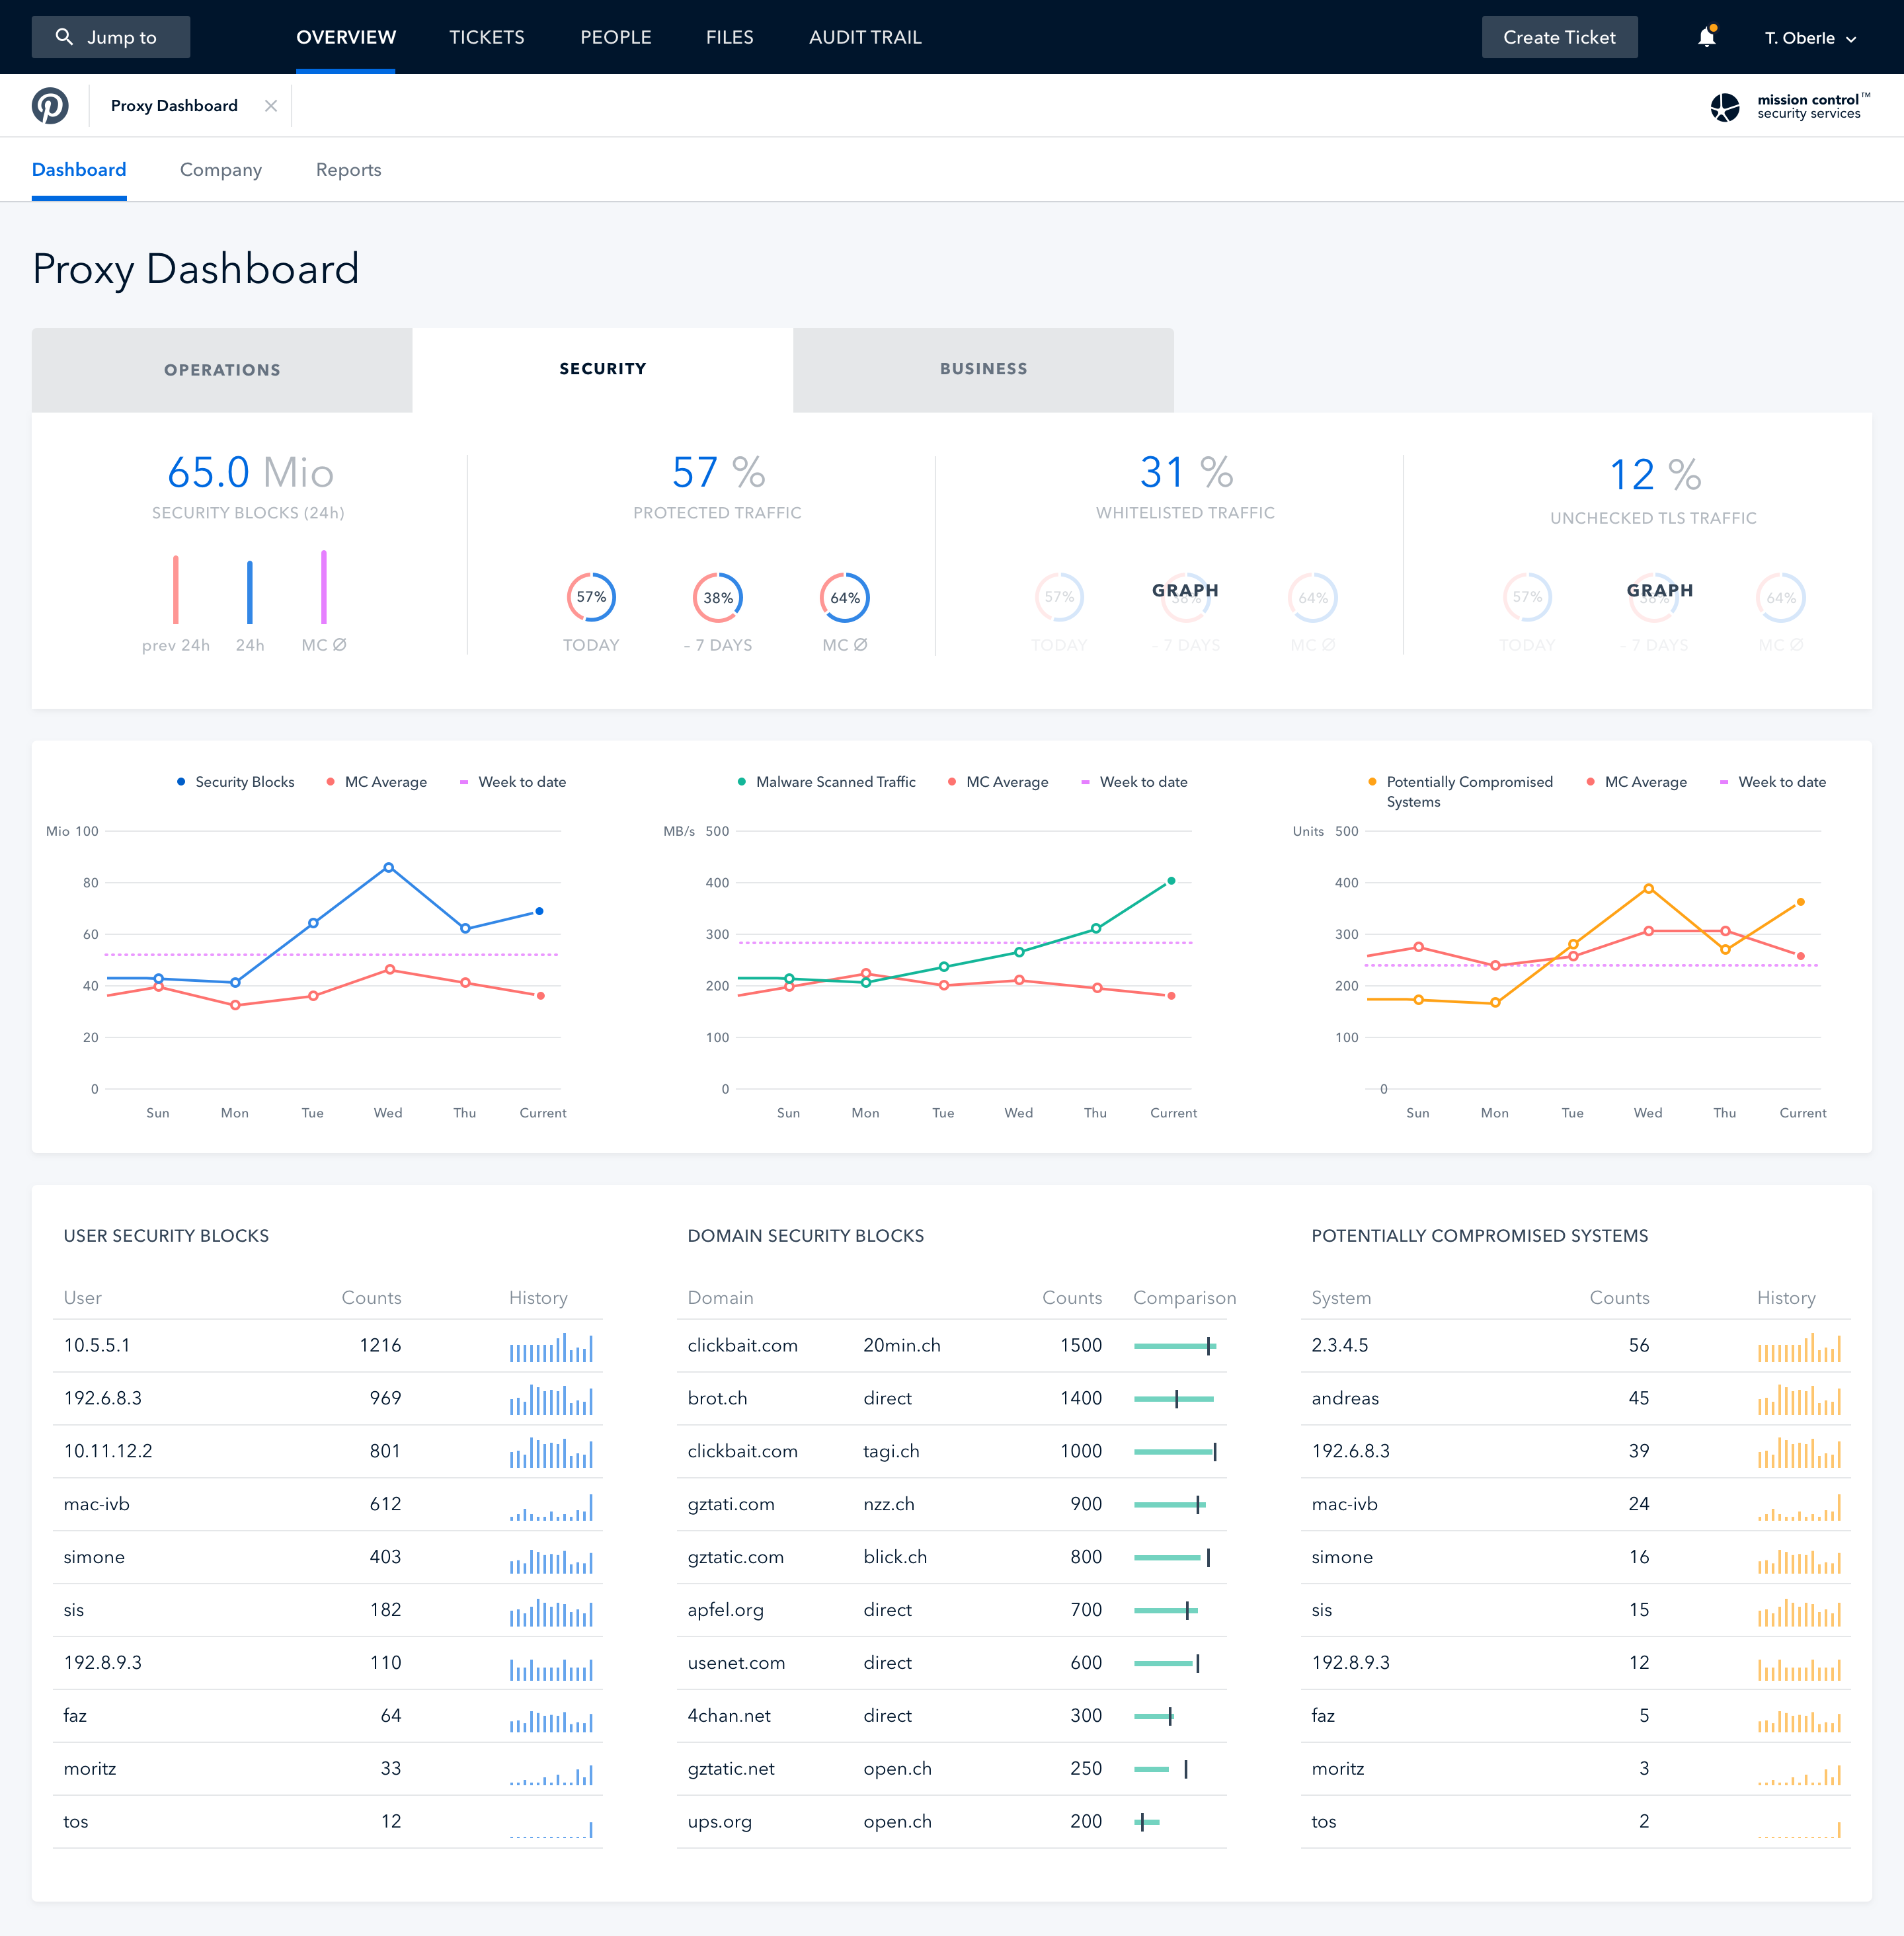
I had the opportunity to completely redesign the user experience and interface design for the Mision Control Portal. Below examples of some of the new screens.

Selected Works

PyreneDesign System
Data PlatformBranding / Logotype
25 Years of Traffic AccidentsData Visualization
Dashboards & GraphsUser Interface
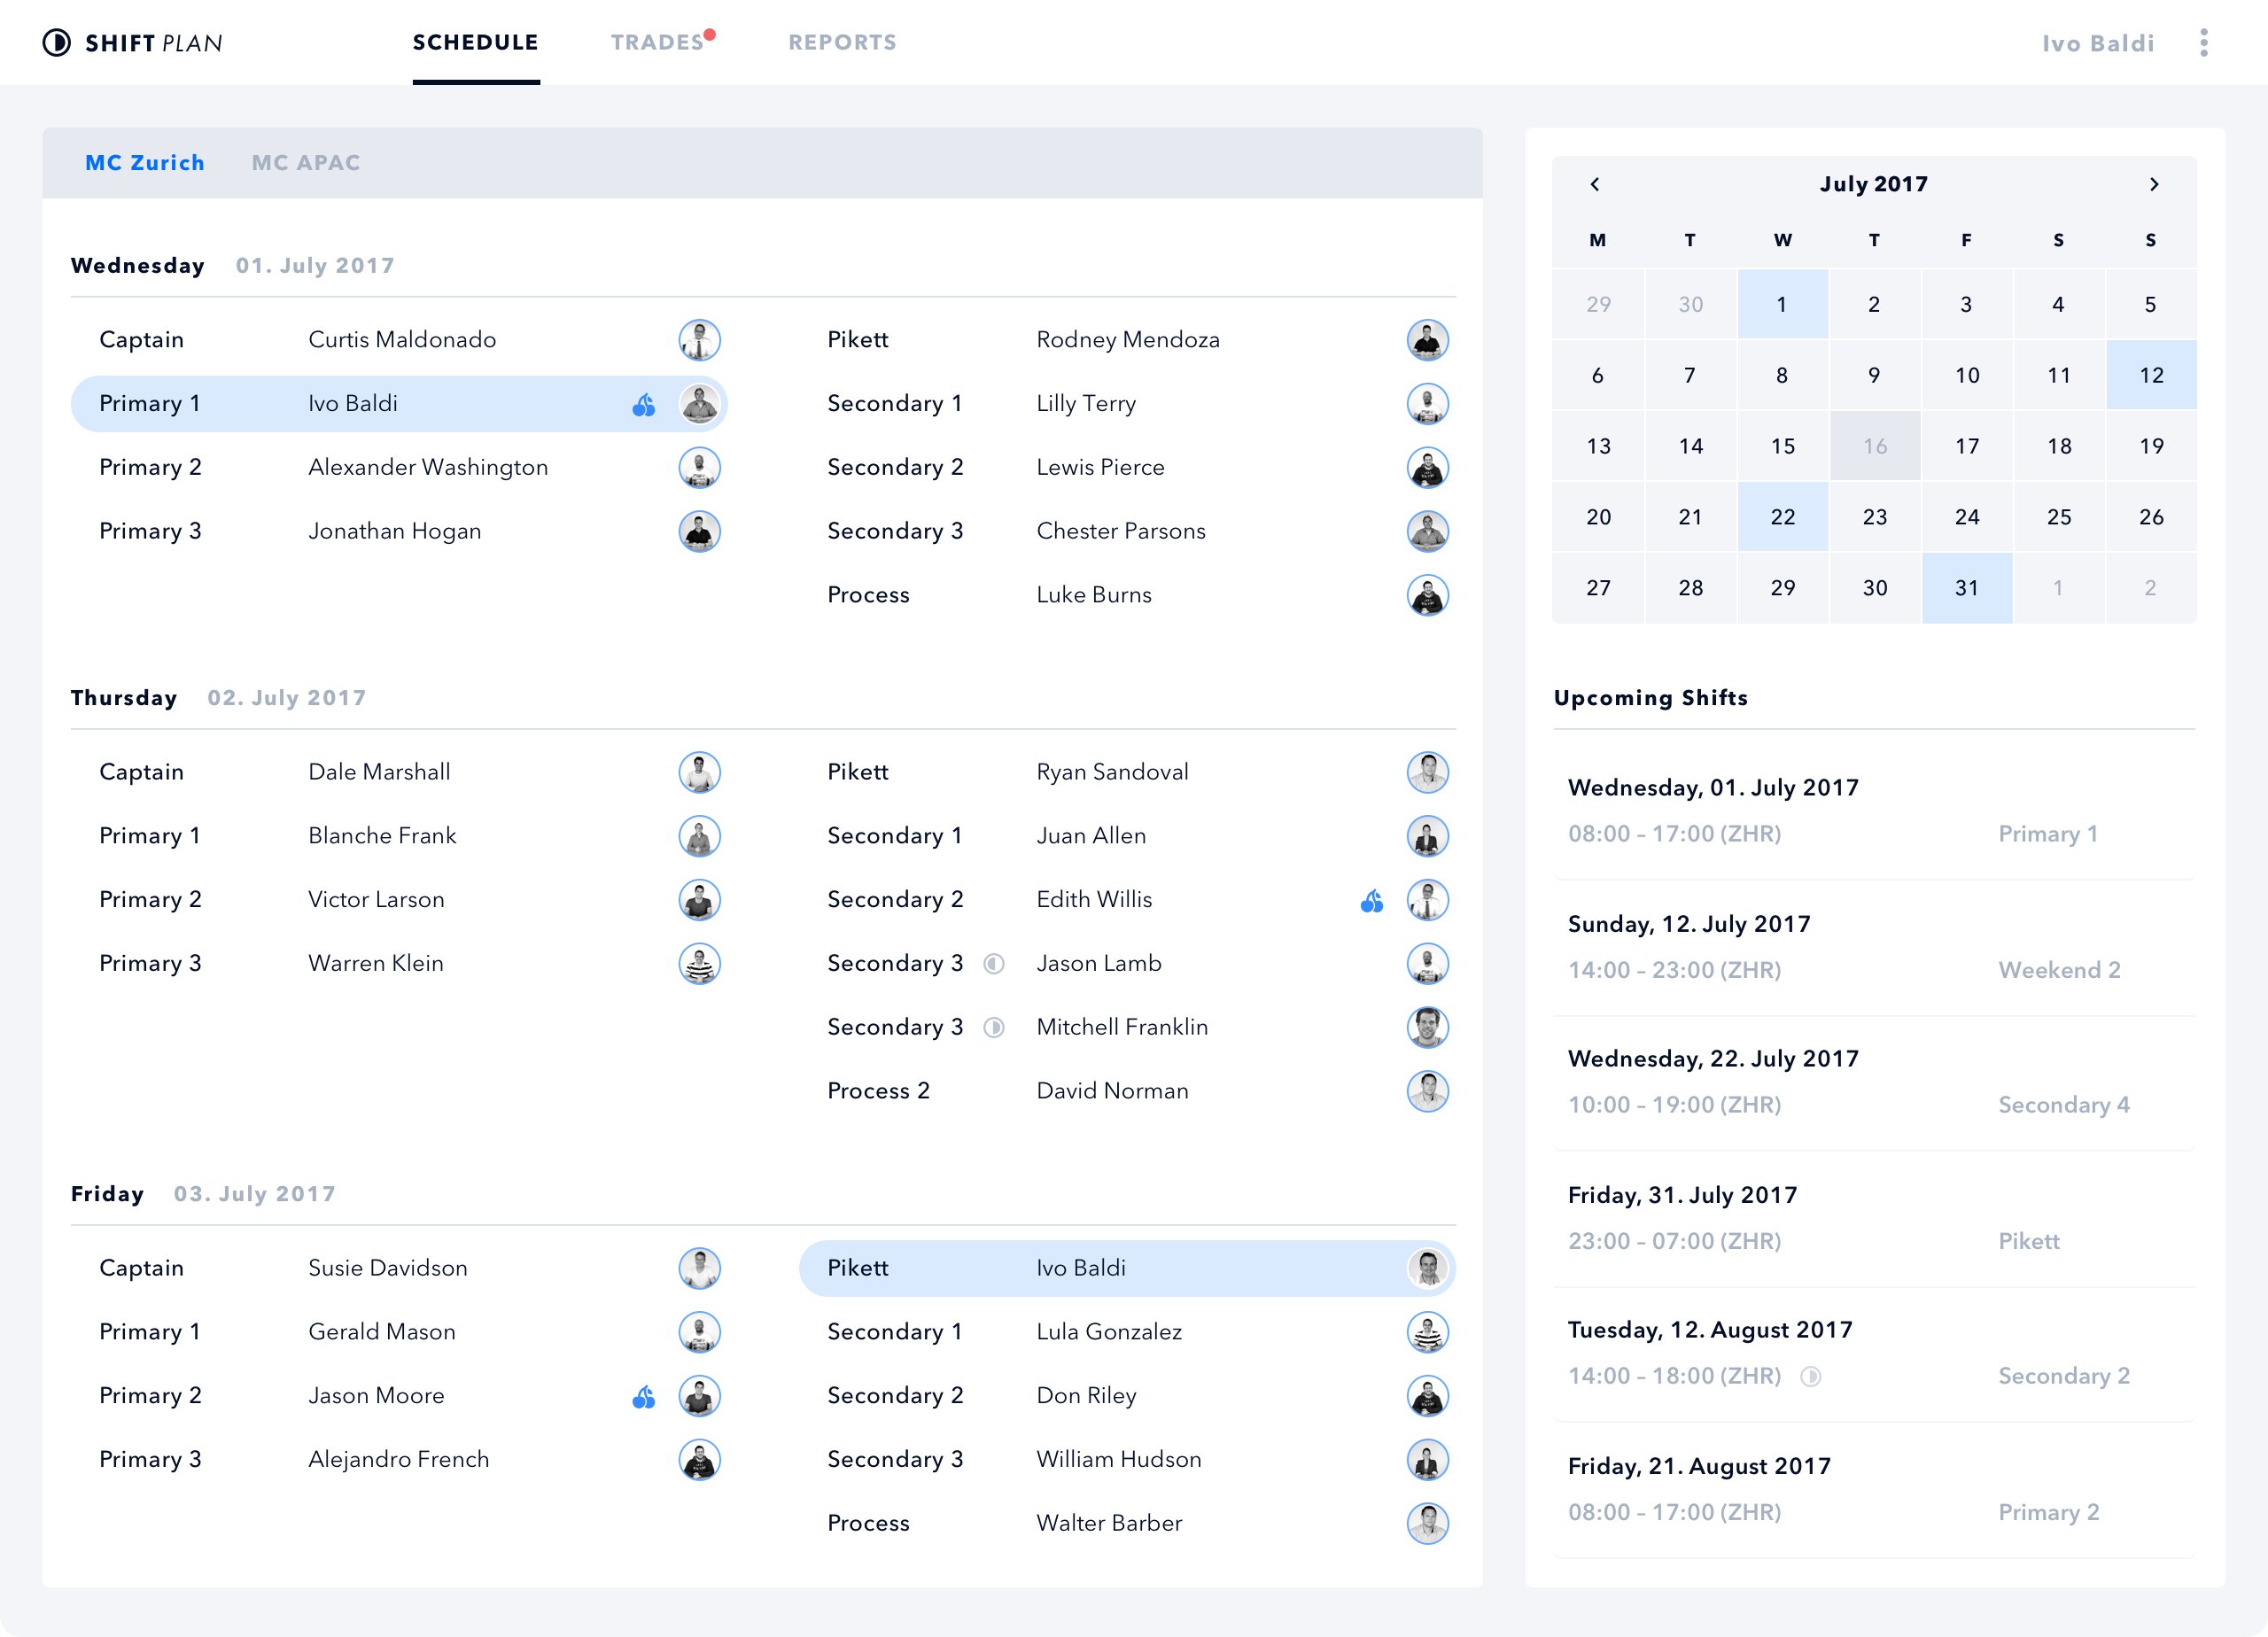
Shift PlanUser Interface
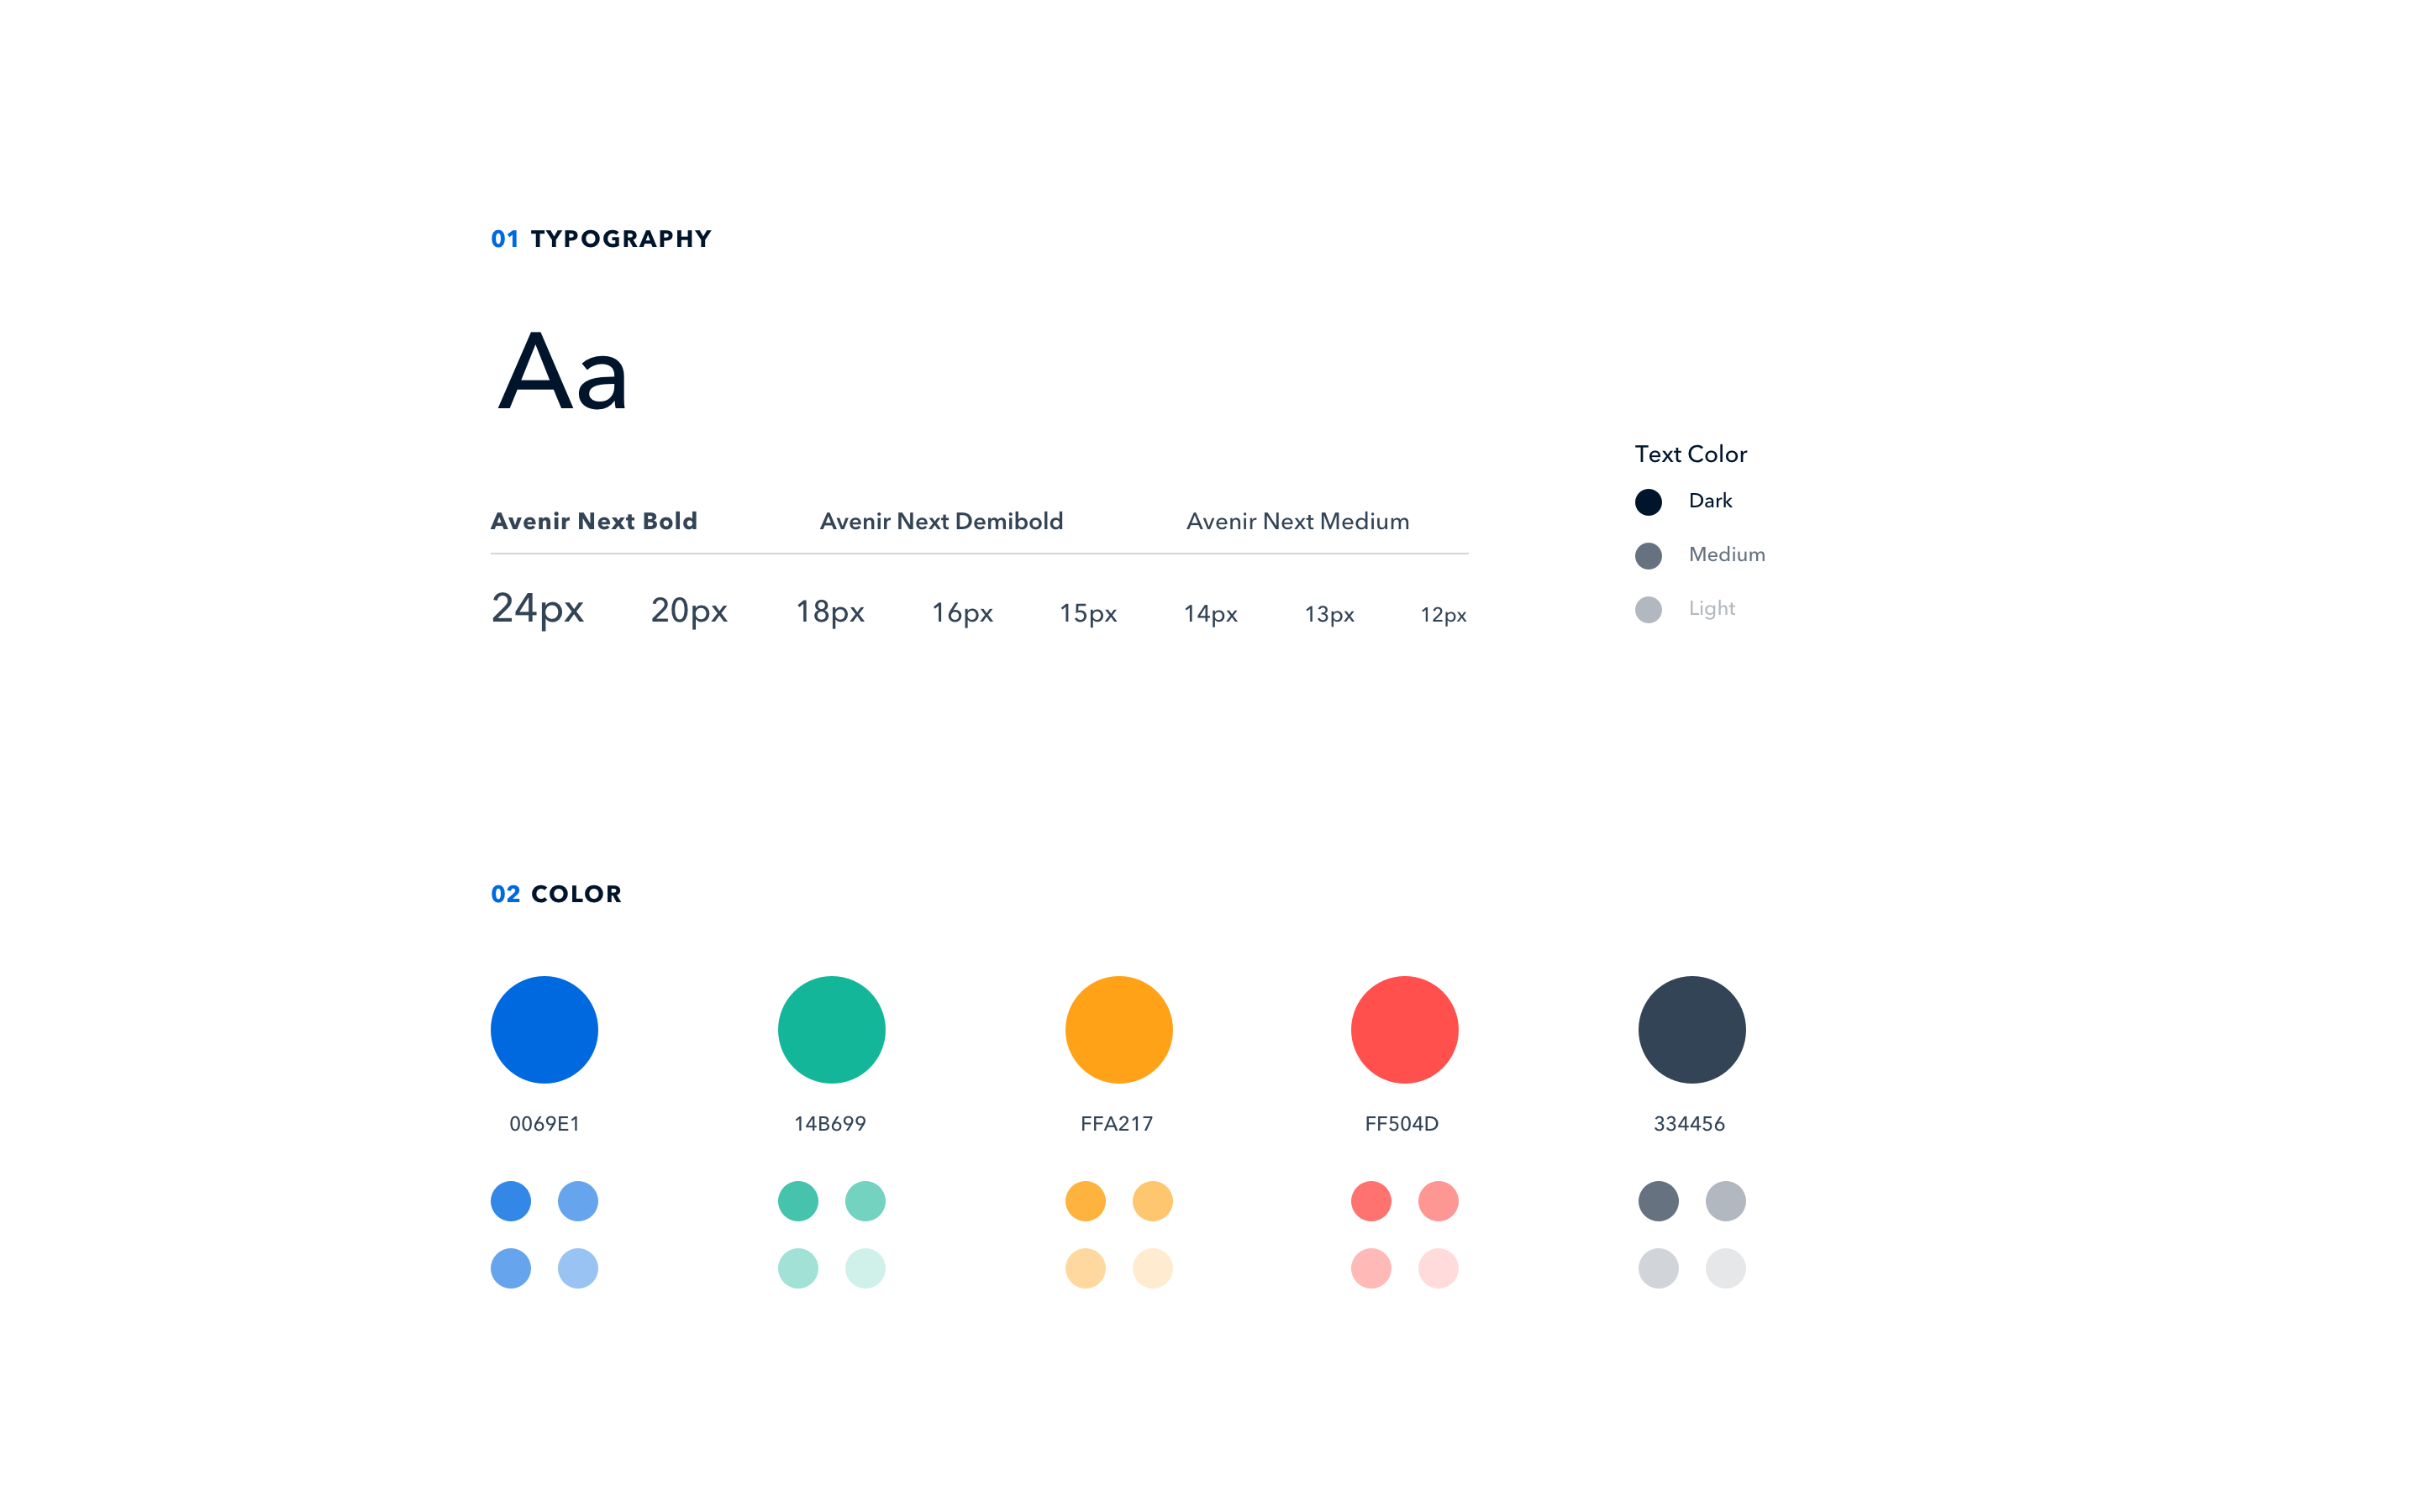
Design SystemUser Interface